

Insights / Smart Energy
Reducing Renewable Downtime: AI Agents in Energy
Why high availability can hide large energy losses, what really causes renewable downtime, and how AI agents can act on it without taking control away from people.

The short answer
Downtime in renewables is measured in lost energy, not lost hours: a short outage at peak sun or wind costs far more than the same outage at night. Dashboards show that something failed but leave diagnosis, ticketing, parts and scheduling to people, and that queue is where downtime grows. AI agents, also called cognitive agents, shorten the path from signal to decision to action. They triage alarms, gather evidence, draft work orders and plan visits, while humans approve anything that changes how a plant runs.
Key takeaways
- Track lost production in MWh as well as availability in percent; timing decides the real cost of an outage.
- Most downtime is a chain: a fault, missing context, slow hand-offs and logistics. Dashboards address only the first link.
- Delegate fast, repetitive, administrative work to agents; keep control, protection and safety decisions with people.
- Approvals, role-based permissions and full audit logs are preconditions, not add-ons.
Why availability is not the same as productivity
Renewable operators often report availability: the share of time an asset is able to run. An asset can score well on availability and still lose a lot of energy, because a short outage at the wrong moment causes a large production loss.
Take a solar farm that is 98% available over a month. If the 2% of downtime fell in the brightest midday hours, the energy lost is far more than 2% of the month's potential. The same applies to an hour lost during a strong wind spell or a high-price window. Every hour offline at those moments is revenue that cannot be recovered.
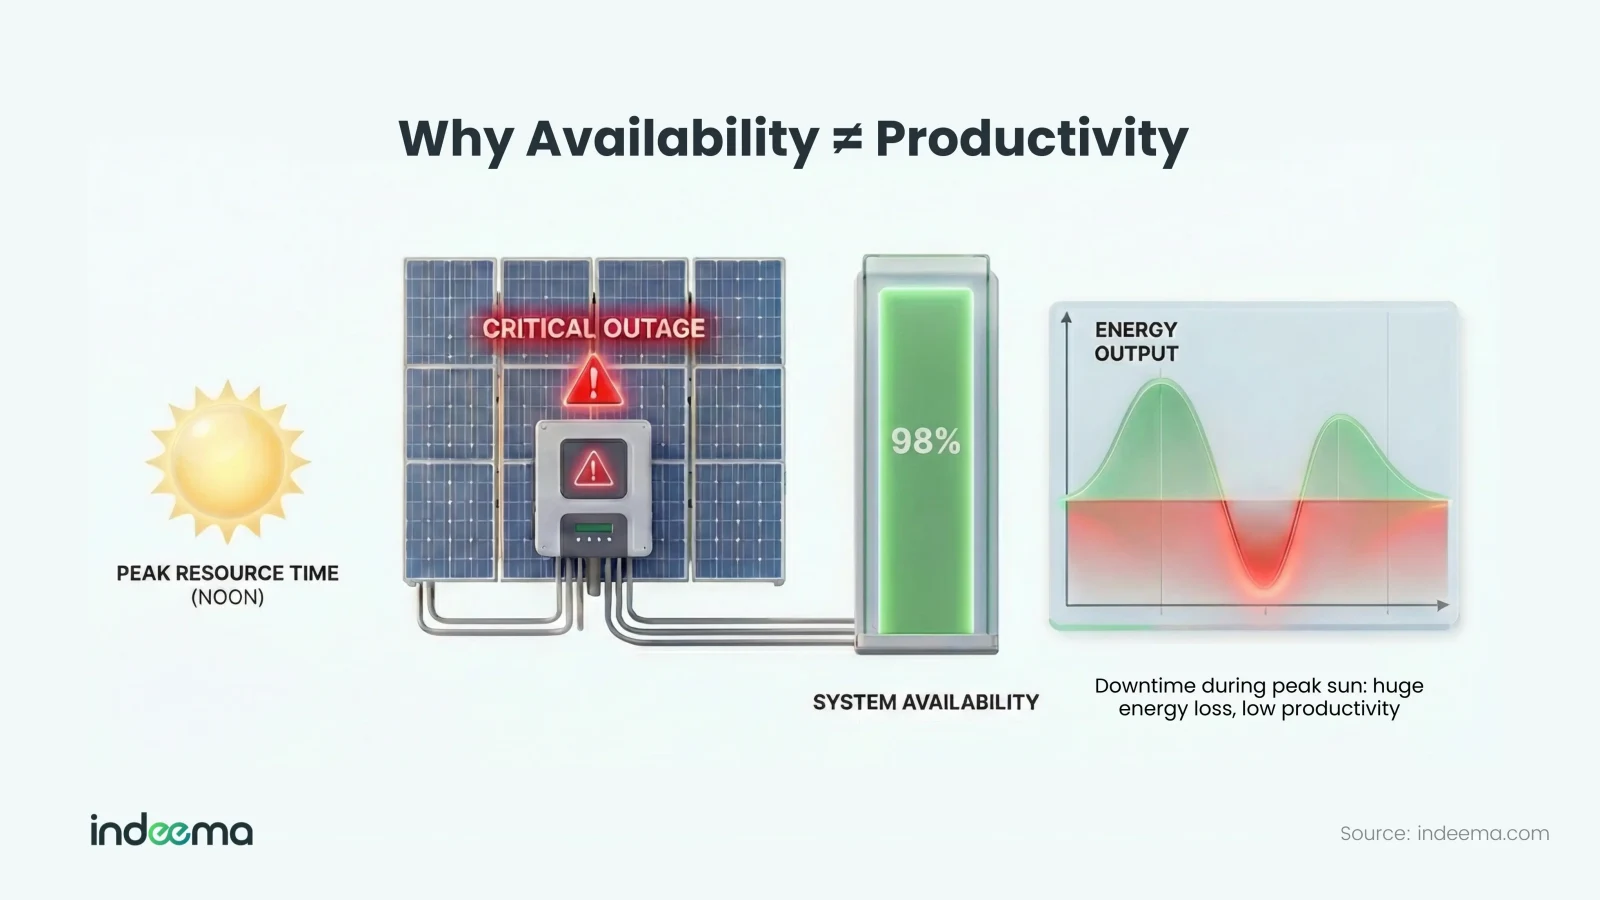
Availability is time-based; production loss is energy-based. That is why some operators also track energy-based availability or potential production loss in MWh. Good asset management is not only maximising uptime. It is also making sure the downtime that does happen avoids the worst timing, for example by planning maintenance for nights or low-wind periods.
What counts as downtime: planned and unplanned
- Downtime (renewables)
- Any period when a turbine, PV array or battery system cannot produce or deliver power although the resource is there: the wind is blowing or the sun is shining, but the equipment is not converting it.
Planned downtime is scheduled maintenance or upgrades, timed for low-impact windows. Unplanned downtime comes from faults such as gearbox failures, inverter trips or communication outages. It causes sudden energy loss and usually higher repair costs.
Much of an operations team's work is turning unplanned outages into planned ones through monitoring and preventive maintenance. This is where agents fit: spotting early warning patterns, validating the issue and starting the right workflow before a failure becomes an emergency.
The real causes of downtime, and why dashboards do not fix them
If downtime were only a fault plus an alarm, dashboards would be enough. In practice, outages come from a chain of technical issues, missing context and slow coordination. Dashboards show what happened. They do not shorten the path from signal → decision → action.
- Equipment faults: major components and frequent small electrical issues in converters, controls and sensors. Alarms flag symptoms; people still diagnose the cause and choose the fix.
- Data and monitoring gaps: limited condition monitoring, ambiguous fault codes, missing tags and siloed history lead to slow troubleshooting, ignored alarms or wasted no-fault-found visits.
- Workflow friction: manual ticket creation, copied evidence, approvals and hand-offs between SCADA, CMMS, scheduling and inventory. Each step adds delay and room for error.
- Logistics: remote sites, weather windows, limited crews, crane availability and parts lead times are often the real bottleneck.
- Grid and market context: grid disturbances, curtailment or narrow production windows can cause or amplify downtime, and are easy to misread as equipment failure without that context.
- IT and cyber issues: connectivity loss, server failures or security incidents can push assets into safe modes, and dashboards may disappear exactly when they are needed.
Downtime is rarely one problem. It is several problems chained together, and most of the delay sits in the hand-offs between them.
What cognitive agents are
A cognitive agent, or AI agent, is software that understands an operational goal, decides on next steps and uses existing tools and systems to carry them out, with human oversight at critical points. It does not only answer questions; it completes multi-step tasks.
Instead of only alerting you to a turbine fault, an agent can verify the issue, draft a work order, check whether the spare part is in stock, propose a repair slot that fits the weather and crew availability, and notify the right team. The message changes from "there is a problem" to "here is the problem and what we should do; shall I proceed?"
| Feature | Dashboard / SCADA | AI chatbot | Cognitive agent |
|---|---|---|---|
| Primary function | Visualisation | Information retrieval | Task execution and orchestration |
| Trigger | User query or hard alarm | User prompt | Data anomaly or deviation from a goal |
| Decision-making | None; a person decides | Limited; suggests pre-set answers | Reasons through trade-offs within set permissions |
| Memory | Historic logs | Session-based | Persistent context and learning from outcomes |
| Example output | A graph of temperature over time | "The temperature is 65 °C." | "I have scheduled an inspection for Tuesday based on weather and parts availability." |
Four core capabilities
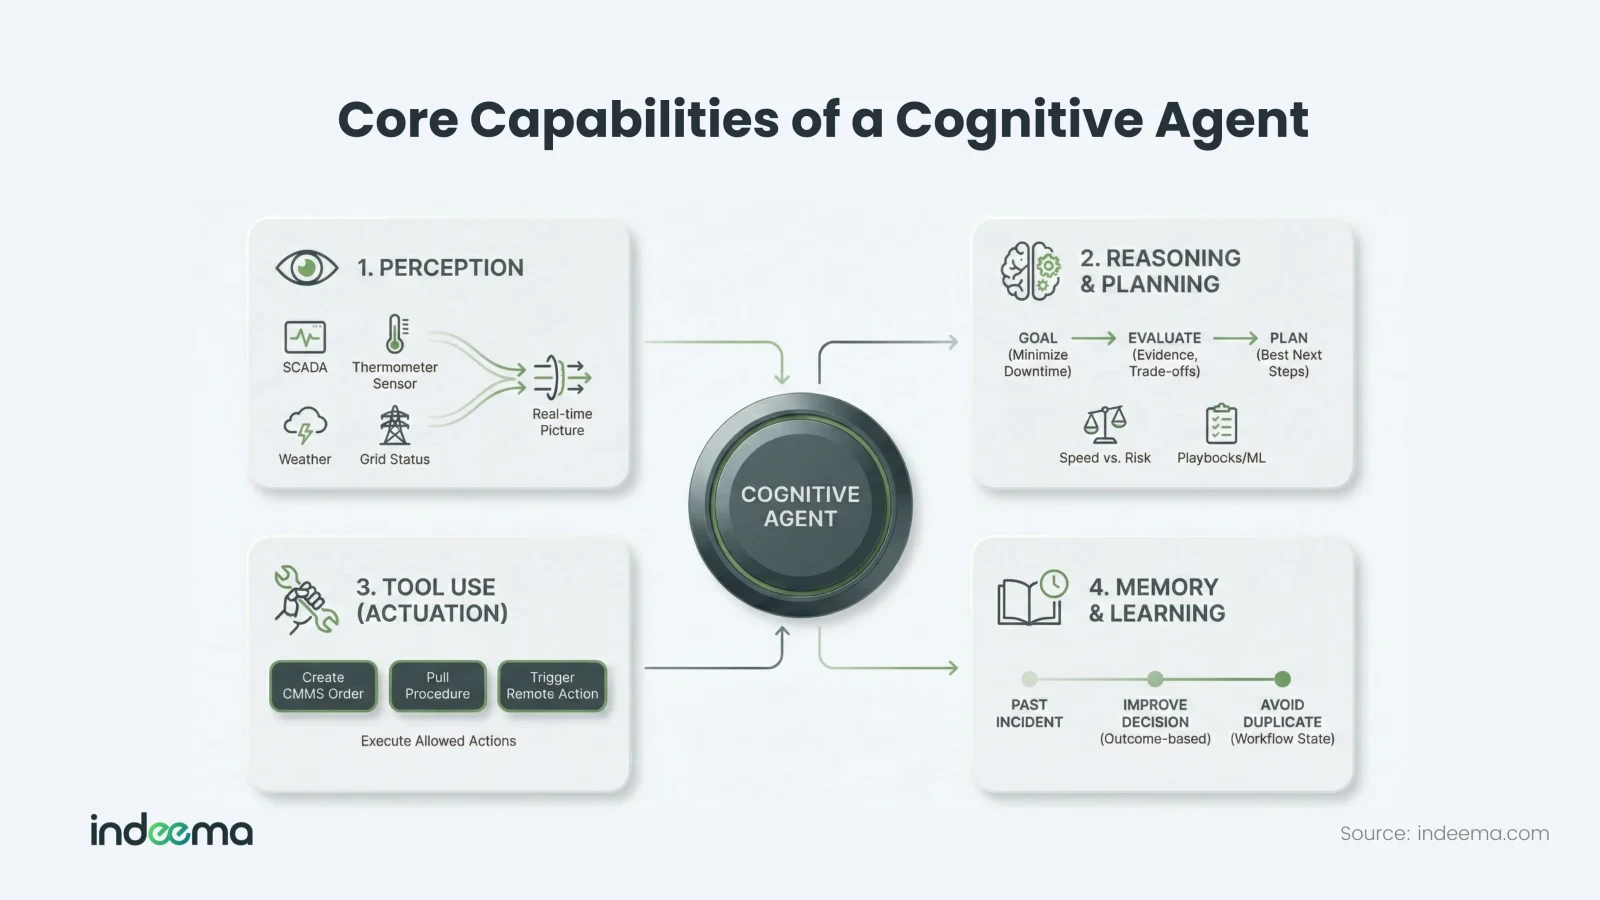
- Perception: reads SCADA alarms, sensor trends, historian data, weather feeds, work orders and grid status to build a real-time picture of asset health.
- Reasoning and planning: given a goal such as minimising downtime, weighs evidence, narrows likely root causes and plans next steps, trading speed against risk and remote action against dispatch, using playbooks and ML models.
- Tool use (actuation): acts through the systems you already run: creates CMMS or EAM work orders, pulls procedures, checks inventory, proposes schedules and sends approved notifications. In low-risk cases it may run allowed remote actions, always within defined permissions.
- Memory and learning: remembers asset history and what worked, and tracks workflow state so it does not open duplicate tickets or order parts twice.
Where agents sit in the operations stack
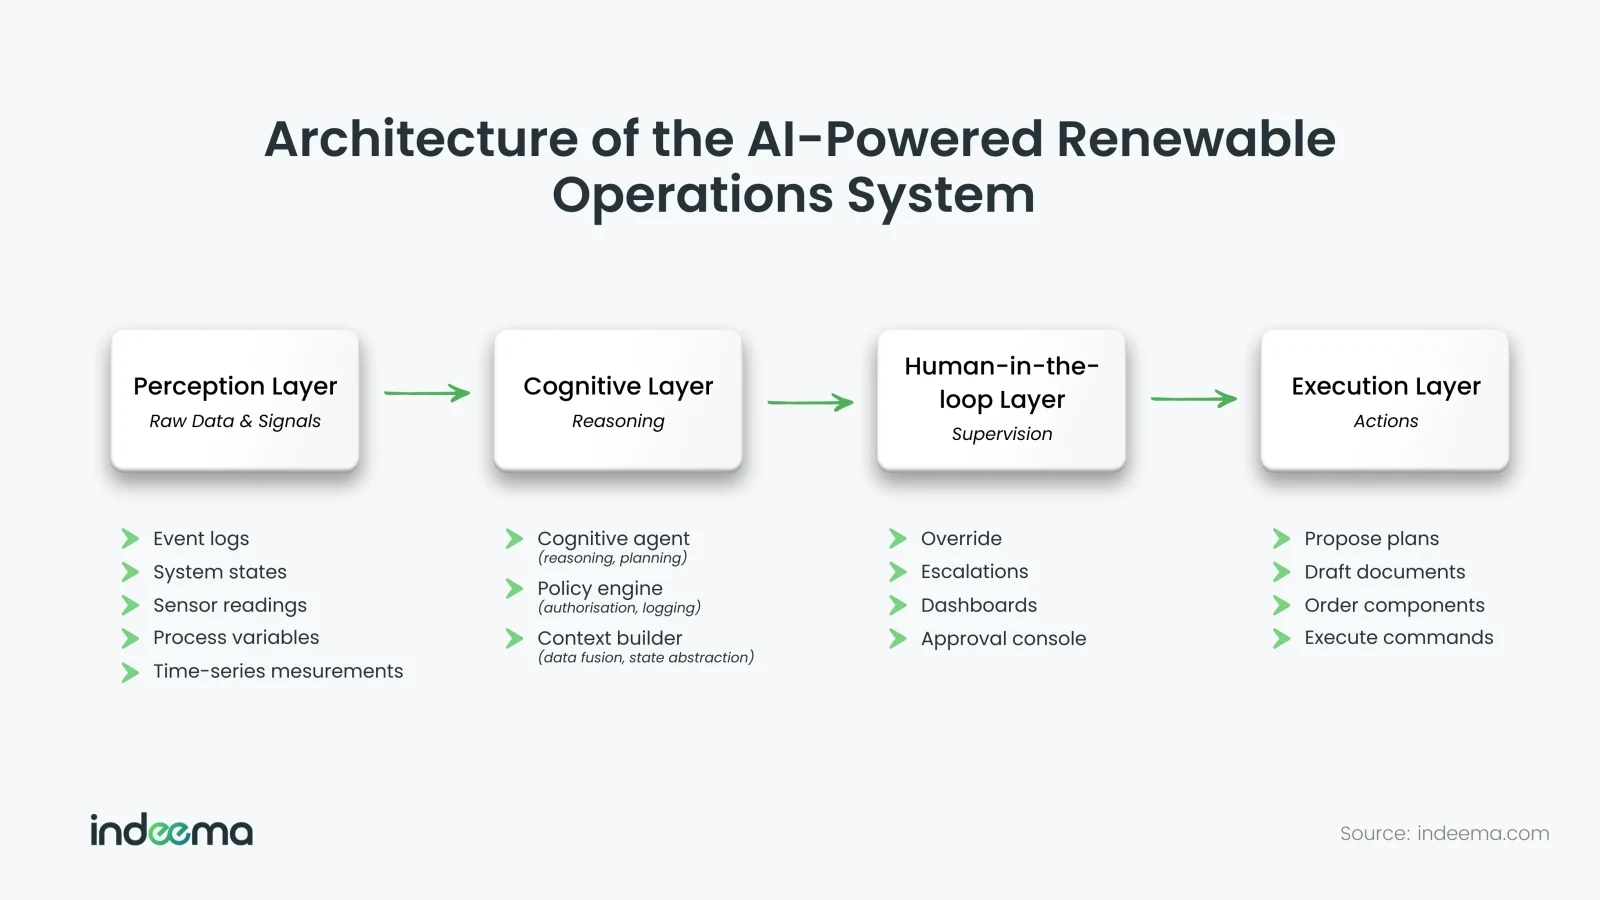
Agents fit into an existing stack as a middle layer between data and action. They take signals from SCADA, historians, condition monitoring, weather, inspections, CMMS or EAM, ERP and ticketing tools. They reason and plan in an orchestration layer that enforces permissions, approvals and audit logs. They then act through existing APIs to draft work orders, propose plans and run approved steps.
- Perception layerEvent logs, system states, sensor readings, process variables and time-series measurements.
- Cognitive layerThe agent's reasoning and planning, a context builder that fuses data, and a policy engine for authorisation and logging.
- Human-in-the-loop layerDashboards, an approval console, escalations and the ability to override.
- Execution layerProposed plans, drafted documents, ordered components and, where allowed, executed commands.
Outcomes of executed actions return to the perception layer, so the agent learns which responses worked.
How agents apply to wind, solar and battery storage
The architecture is similar across asset classes. The signals and the decisions differ.
Wind: mechanical fatigue
- Wake steering: coordinating yaw and pitch of upstream turbines to deflect turbulent wakes away from downstream ones, reducing fatigue loading across the fleet.
- Visual inspection: classifying blade defects such as erosion or lightning damage from drone inspection images, estimating the energy loss of each defect and ordering repairs to balance yield loss against repair cost.
Solar: invisible losses
- Soiling and vegetation: comparing the performance ratio of strings with precipitation data to find the point where a cleaning visit pays for itself, then scheduling cleaners or robotic wipers.
- Inverter health: spotting a gradual rise in internal temperature that may mean a failing cooling fan, and scheduling the replacement at night before it causes a thermal trip.
Battery storage: arbitrage against health
- State of health: weighing a predicted price opportunity against the degradation cost of the extra cycle before committing the battery.
- Safety monitoring: watching cell-level voltage variance, which tends to widen before a cell fails, and proposing to isolate the affected rack or module so the rest of the container keeps running.
Measuring the impact
To show that agents help, measure what operations and asset teams already track, then convert the change into energy and cost.
| Question | KPIs |
|---|---|
| Are assets back sooner? | Availability and energy availability, MTTR, MTTD, alarm-to-action time |
| Are failures caught earlier? | MTBF, repeat failures, planned versus reactive work mix |
| Is less effort wasted? | False alarm and false dispatch rate, truck rolls avoided, hours per incident |
| What is it worth? | Lost production avoided in MWh and revenue, O&M cost per MW, spares stock-outs, availability penalties |
| Is it safe and auditable? | Complete decision logs, reporting time, rushed call-outs in severe weather or at night |
Set a baseline before the pilot, track the same KPIs through it, and report gains in MWh and money alongside risk reduction.
Where the building blocks show up in our work
Agents depend on the layers beneath them: devices that report reliably, platforms that hold context, and control paths that can act. Two projects show those layers in practice.
- Solar energy management: a platform that connects household PV equipment to the cloud and optimises how energy is distributed from real-time production and consumption trends, a basic perceive-and-act loop. The engineering is described in how we built an IoT system for managing solar energy usage.
- Vibration diagnostics: processing three-axis vibration data from accelerometers with Fourier analysis to detect the spectral signatures of defects such as bearing damage, and raising direct alarms on recognised patterns without waiting for manual review.
Engineering trade-offs
Agent-executed actions vs agent-drafted actions
- You gain
- Executing low-risk steps directly removes the last hand-off and shortens time to restore.
- You pay
- Every executed action needs permissions, guardrails and a rollback path, and a wrong action reaches the plant immediately.
- Choose it when
- Let the agent execute only well-understood, reversible, low-risk steps; draft everything else for approval.
Edge detection vs cloud reasoning
- You gain
- Pattern detection at the edge reacts quickly and keeps working when the link drops.
- You pay
- Edge devices have limited context; fleet history, weather and parts data live upstream.
- Choose it when
- Detect and protect at the edge; reason about scheduling, parts and crews in the cloud.
What to delegate to an agent, and what to keep with people
A rule of thumb: let the agent handle fast, repetitive, administrative work, and keep people in control of anything that can materially change plant behaviour, safety or revenue.
| Device | Examples | Who decides | Agent's role |
|---|---|---|---|
| Triage and evidence | De-noising SCADA alarms, grouping related events, summarising signals against baseline | Agent | Produces one incident brief instead of many alarms |
| Workflow and logistics | Drafting CMMS work orders, checking spares, proposing crew slots and weather-safe access windows, technician brief packs | Agent drafts; planner confirms | Removes hand-off delay |
| Coordination | Notifying the control room, site technicians and planners with approved templates; preparing outage request drafts | Agent within templates | Keeps everyone on the same incident record |
| Control operations | Breaker switching, curtailment and setpoint changes, grid-code responses, resets where risk is not trivial | Human approval | Recommends with rationale and evidence |
| Protection and parameters | Inverter settings, pitch and yaw parameters, battery charge and discharge limits, firmware and configuration changes | Human approval | Prepares the change and its justification |
| Safety and cyber overrides | Bypassing interlocks, suppressing alarms outside policy, unusual commands, access beyond least privilege | People only | None; the agent flags and escalates |
Decision rule: Start with triage, evidence and workflow automation, where mistakes are cheap and delay is expensive. Expand to remote actions only after approvals, role-based permissions and full audit logs record what the agent saw, decided and did, who approved it and what happened.
Common mistakes
Optimising availability alone
Outages at peak resource hours look minor in the report but dominate the energy loss.
Instead: Track lost production in MWh and plan maintenance windows against forecast resource.
Adding another dashboard
The alarm is seen sooner, but diagnosis, ticketing and logistics still queue up behind people.
Instead: Automate the steps between the alarm and the work order.
Giving the agent control before governance
Without approvals and audit logs nobody can trust or reconstruct what happened.
Instead: Put permissions, approvals and logging in place first, then widen what the agent may do.
Where we've built this
Case studyA web service for monitoring and configuring residential solar systemsA solar energy management platform that connects PV equipment to the cloud and acts on real-time production and consumption: the perceive-and-act foundation agents build on.Questions engineers ask
How do I tie energy spikes to downtime events?
Put production, resource data (irradiance or wind speed) and the event log on one timeline per asset. Compare expected output from the resource with actual output, and attribute each gap to the downtime events active at that moment. That gives lost production in MWh per event instead of only outage hours.
How is AI used to reduce unplanned downtime in energy operations?
It detects early warning patterns in sensor and alarm data, narrows likely causes, and automates the steps between an alarm and a repair: evidence gathering, work orders, parts checks and scheduling. People still approve control and safety decisions.
How can remote experts help reduce power plant downtime?
When evidence, history and procedures are gathered automatically into one incident brief, a remote specialist can diagnose and decide without travelling to site, and the technician who does travel arrives with the right parts and steps.
Was this useful?
Where this shows up in our work
SolutionSmart Energy OperationsConnecting renewable assets, monitoring and maintenance systems so that signals turn into approved actions is the operations problem our smart energy work addresses.For the operating context of wind and solar assets, from remote sites to weather windows, see Connected systems for solar and wind energy.
First published
Apply this to your product