


Insights / Industrial IoT
Vibration Diagnostics with Industrial IoT: How the iReDS System Monitors Machinery
How IoT vibration diagnostics turns accelerometer signals into maintenance decisions, the architecture choices behind it, and how the iReDS system was built.


The short answer
IoT vibration diagnostics puts accelerometers on motors, pumps, bearings and gearboxes, measures how they vibrate, and compares that signature with the machine's healthy baseline. Imbalance, misalignment, looseness and bearing wear each change vibration in characteristic ways, often well before the machine fails. A connected system adds continuous measurement, edge processing and a shared view across many machines, so maintenance can be planned instead of reacting to a breakdown.
Key takeaways
- Vibration is an early signal: many mechanical faults change it before temperature, noise or output do.
- Raw accelerometer data is heavy. Decide early which features are computed on the device and what is sent upstream.
- Sensor mounting, calibration and self-diagnosis decide whether the data can be trusted at all.
- Start with thresholds against a baseline; add models once you have labelled history from your own machines.
Why vibration is the signal to watch
Rotating equipment such as motors, pumps, fans, gears and bearings sits at the centre of most production processes. When one fails without warning, the cost is rarely the part. It is the stopped line, the rushed repair and the damage that spreads to neighbouring components.
Most mechanical faults announce themselves first as a change in vibration. A bearing starting to wear, a shaft drifting out of alignment or a mounting bolt working loose all alter how the machine vibrates while it still runs normally. Catching that change early is what turns an emergency into a planned maintenance job.
- Equipment vibration diagnostics
- Measuring and analysing the vibration of machine components to assess their condition, detect developing faults and decide what maintenance is needed and when.
How vibration diagnostics works
- Place sensorsAccelerometers are mounted on bearing housings and other vibration-prone points of critical components.
- AcquireThe sensors capture vibration continuously and convert it into electrical signals.
- Process the signalFiltering, amplification and digitisation remove noise and extract usable data.
- AnalyseAlgorithms look at frequencies, amplitudes and patterns and compare them with the baseline.
- Assess and reportMaintenance teams see the condition, alerts and recommended actions: repair, replace or adjust.
New readings keep updating the baseline comparison, so a slow drift becomes visible long before it becomes a failure.
What the analysis looks for depends on the fault. The patterns below are the common starting points used in condition monitoring of rotating machines.
| Fault | Typical vibration sign | What it usually means |
|---|---|---|
| Imbalance | Strong component at running speed, mostly radial | Uneven mass on a rotor, fan or impeller |
| Misalignment | Running speed and its second harmonic, often with high axial vibration | Shafts of coupled machines are not on the same axis |
| Mechanical looseness | Many harmonics of running speed, erratic phase | Loose mounting, worn fit or a cracked base |
| Bearing wear | High-frequency energy and bearing defect frequencies | Damage developing on races or rolling elements |
| Gear problems | Changes around the gear-mesh frequency and its sidebands | Worn, chipped or misaligned teeth |
Reading a bearing’s vibration: a measured example
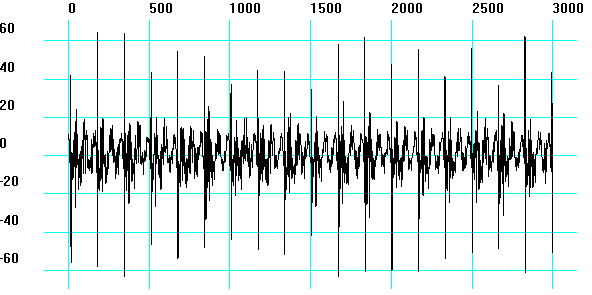
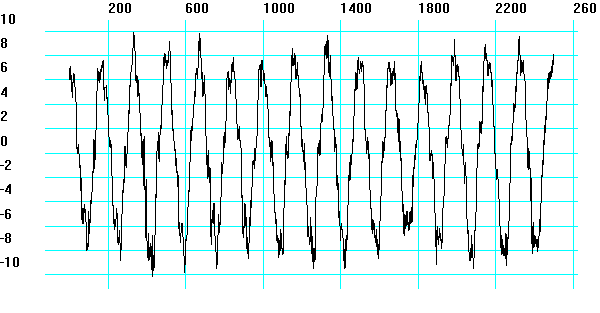
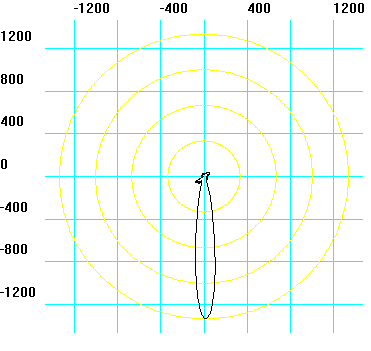
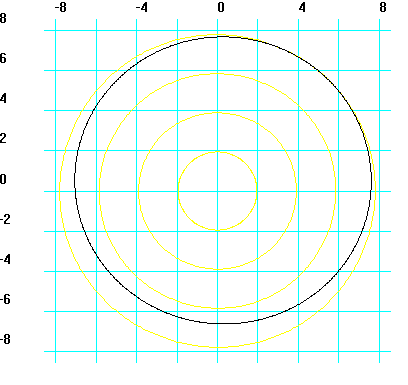
In 2016 Indeema engineers published a measurement from the rolling bearings of a 30 kW electric motor running at 3,630 rpm (mechanism class II), taken with Indeema’s Vidisy signal-processing platform. One bearing assembly had an outer-ring defect; the other was in working order. The comparison shows why one overall vibration level is not enough, and what the time signal, the correlation function, the spectrum and the random part of the signal add.
| Measure | Outer-ring defect | Working bearing |
|---|---|---|
| RMS vibration velocity | 9.7 mm/s, above the normal level for this machine class | 2.4 mm/s, within the normal level |
| Signal-to-noise ratio | 4:1 | 10:1 |
| Dmin / Dmax ratio | 0.03 | 0.92 |
| Time signal | Strong impacts as rolling elements meet the defect on the race | Regular oscillation at shaft rotation |
| Correlation function | Impacts in the tail at the shaft-rotation frequency: rotating parts striking the defect | Closed oscillations characteristic of shaft rotation |
| Power spectrum | Shaft frequency and its multiples, strongly modulated by random processes | Shaft frequency and its harmonics, without that modulation |
| Variance of the random part | Strong emissions during rotation: non-stationary | Almost a perfect circle: stationary |
| Conclusion | Critical: replace the bearing | Satisfactory |
The architecture of a connected vibration monitoring system
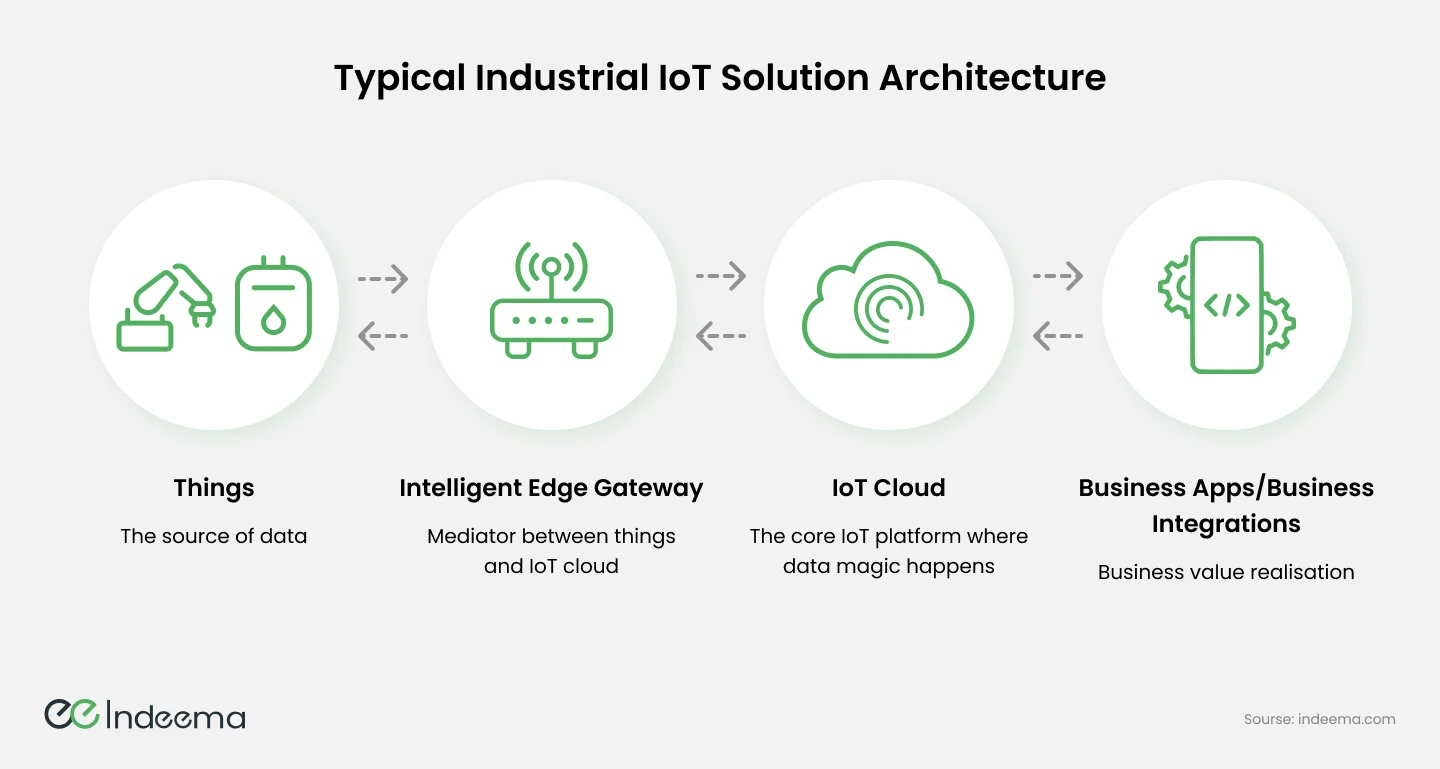
A connected system follows the same layers as most industrial IoT solutions: things that produce data, an edge layer that collects and reduces it, a cloud or central platform that stores and analyses it, and business applications where people act on it.
Sensors and edge processing
Vibration analysis needs high sampling rates, so a single three-axis accelerometer can produce far more data than a typical temperature or pressure sensor. Sending all of it upstream is expensive and often unnecessary. The usual pattern is to compute features close to the sensor, such as overall levels, peaks and frequency spectra, and to send raw waveforms only when something looks wrong or on request.
Connectivity and protocols
Wired links such as Ethernet or industrial fieldbuses (Modbus, PROFIBUS, EtherCAT) give reliable, deterministic communication on the plant floor. Wireless options such as Wi-Fi, Bluetooth or cellular suit retrofits and hard-to-wire machines. Between layers, MQTT carries telemetry efficiently over constrained networks, OPC UA connects to automation systems and plant software, Modbus remains common at device level, and CoAP serves very constrained devices.
Integration with what the plant already runs
- Protocol translation: gateways bridge devices that speak different protocols.
- Legacy systems: middleware and adapters move data between older equipment, SCADA and the new platform.
- Data mapping: readings from different devices are normalised into one model with consistent units, timestamps and asset names.
- Standards: using MQTT and OPC UA rather than proprietary links keeps future integration simpler.
What the software has to handle
- Scale: the platform should take on more machines, sensors and sites without being redesigned.
- Real-time processing: streams must be ingested and analysed fast enough for alerts to be useful.
- Reliability: fault tolerance and buffering so that a network or server problem does not leave gaps in the history.
- Interoperability: support for many device types, protocols and the systems already in the plant.
- Security: encrypted transport, device and user authentication, access control and a plan for updates.
Vibration monitoring rarely lives alone. It usually feeds the same operators who use SCADA for supervision, and the maintenance and quality systems that plan the work. Designing the data model for those consumers from the start avoids a second integration project later.
Use case: building the iReDS vibration diagnostics system
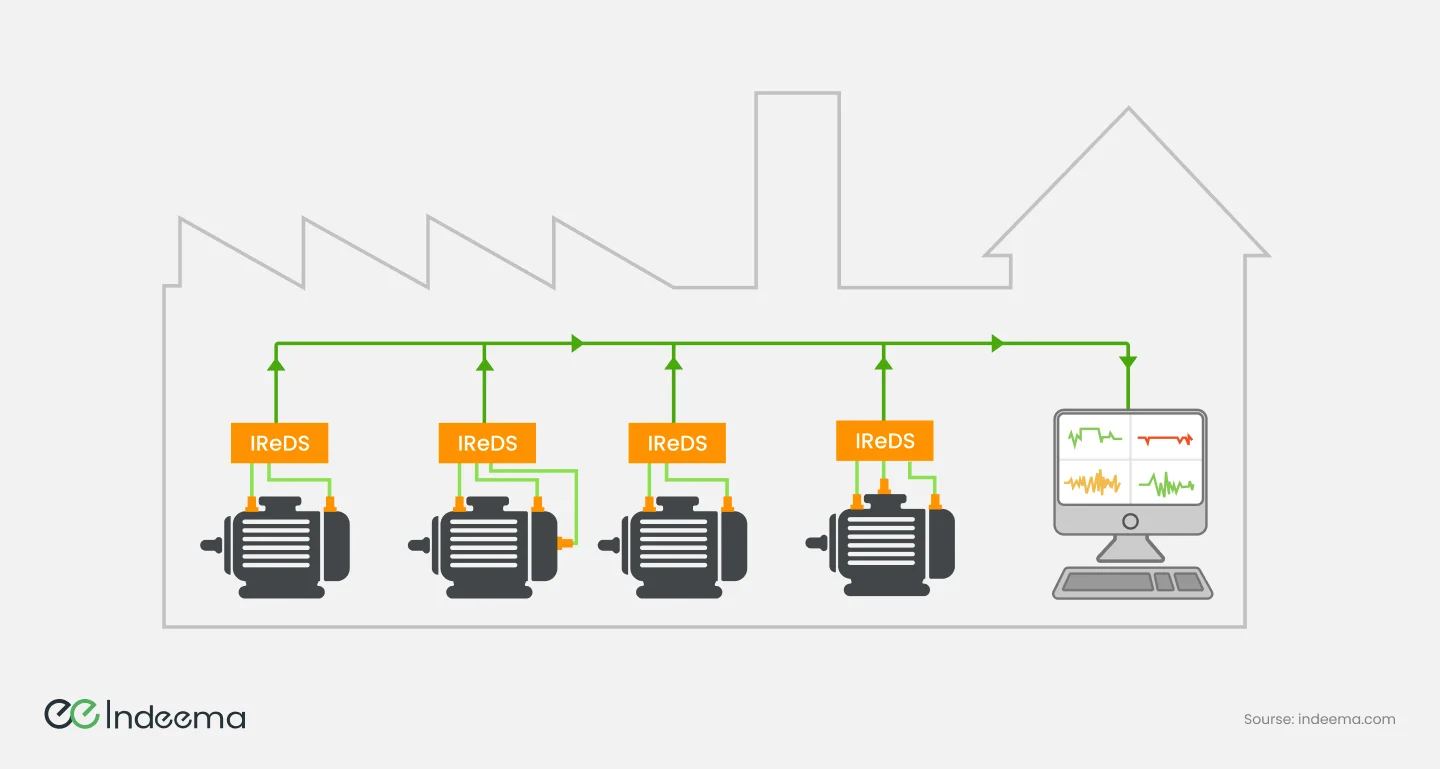
A Swiss client asked Indeema to build a complete system for monitoring critical rotating mechanisms, so that developing problems could be found early, maintenance planned and unplanned downtime reduced. The work began with a review of the mechanisms themselves: how they operate and how they can fail.
Embedded development and assembly
The team focused first on efficient low-level data acquisition: reliable communication between the MCU and multichannel accelerometers, extracting raw data from each channel and implementing the communication protocols. The firmware includes calibration and self-diagnosis routines so that measurement accuracy can be trusted over time.
Hardware integration
PCBs and components were installed in the housing according to detailed mechanical drawings, and every sensor connection, cable route and component was tested before the system went out. The sensors are built for harsh factory conditions and record vibration on three axes.
Interface, web and cloud
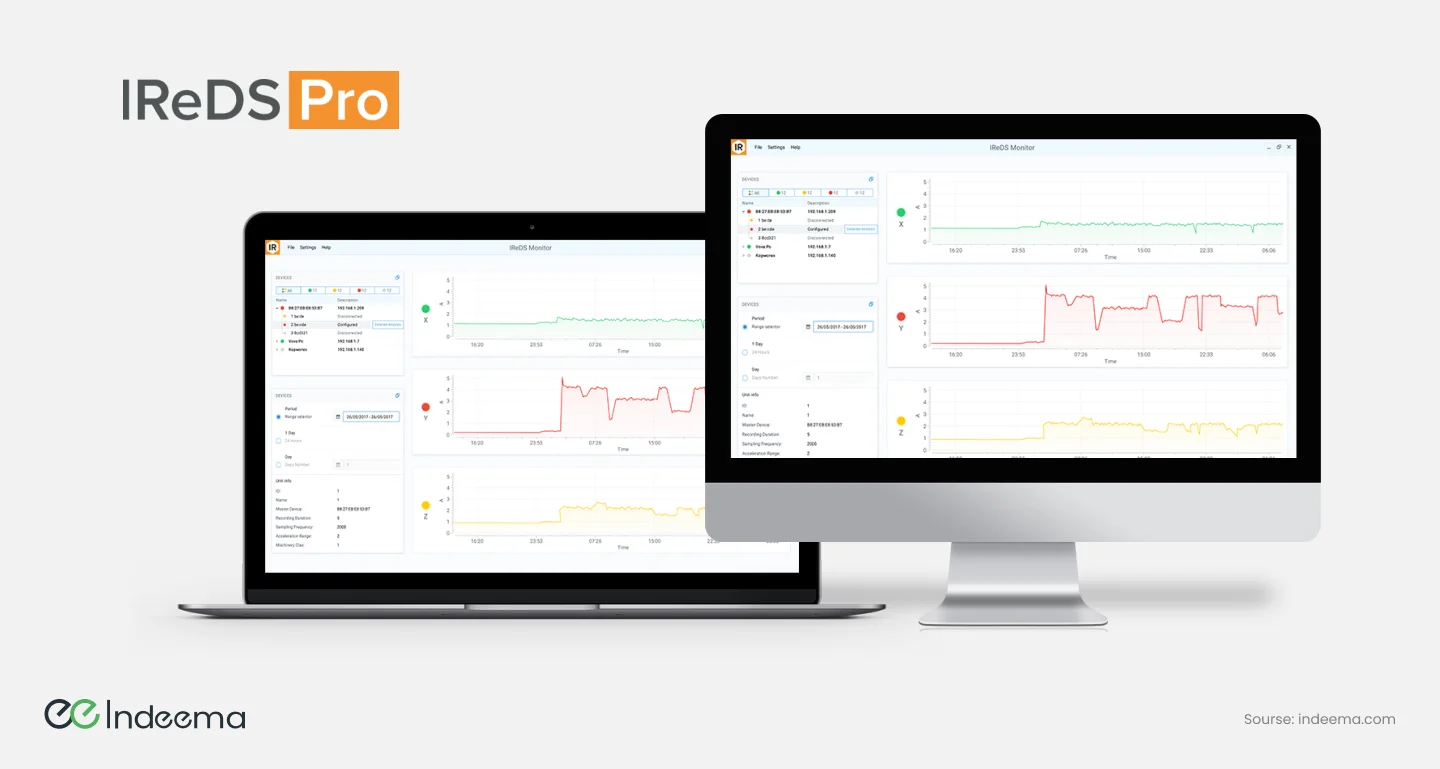
The design team built an interface for users with different levels of technical background: a dashboard with real-time sensor data, alerts and troubleshooting tips. A web component supports fleet management and analysis of vibration data across many units, with the option of cloud-based machine learning for deeper analysis. Server, network, database and cloud configuration were chosen for availability, scalability and security.
Testing and customisation
QA covered input-signal validation, load testing, usability and workflow tests, and the accuracy of user documentation and tutorials. Each customer can tune the system: sensor sensitivity, data-processing parameters and report formats are configurable, and big-data processing can run locally or in the cloud depending on the site's requirements.
Engineering trade-offs
Edge feature extraction vs streaming raw waveforms
- You gain
- Edge processing cuts bandwidth and storage and keeps alerts working when the link is down; raw streams keep every detail for later analysis.
- You pay
- Edge processing fixes which features exist and needs capable firmware; raw streaming needs heavy networks and storage.
- Choose it when
- Compute features at the edge by default; capture raw waveforms on alarm, on schedule or on request.
Wired vs wireless sensors
- You gain
- Wired gives power, bandwidth and deterministic timing; wireless makes retrofits and hard-to-reach machines practical.
- You pay
- Wired installation is slow and costly on existing lines; wireless limits sampling, needs batteries and must cope with RF noise in a factory.
- Choose it when
- Wire the critical, high-speed assets; use wireless for wide coverage of secondary machines.
Threshold alarms vs machine-learning models
- You gain
- Thresholds against a baseline are simple to explain and work from day one; models can catch subtle patterns and predict trends.
- You pay
- Thresholds miss complex patterns and need tuning per machine; models need labelled history and ongoing validation.
- Choose it when
- Start with baselines and thresholds; add models once you have enough history and confirmed faults from your own machines.
Local vs cloud processing
- You gain
- Local processing keeps data on site and responds fast; cloud processing scales analytics and compares machines across sites.
- You pay
- Local limits fleet-wide insight and needs on-site servers; cloud depends on connectivity and raises data-ownership questions.
- Choose it when
- Let site policy and connectivity decide; design the system so the same analysis can run in either place.
Before you instrument the first machine
Questions that decide whether a vibration monitoring rollout produces decisions or just data:
- Rank assets by the cost of an unplanned stop, and start with the few that matter most.
- List the failure modes for each asset and the vibration sign you expect for each.
- Choose mounting points and methods with the maintenance team; a poorly mounted sensor measures the bracket, not the machine.
- Record a healthy baseline at known operating conditions before you set any alarm.
- Decide what is computed on the device, what is sent and how gaps are backfilled after an outage.
- Agree who receives each alert and what action it should trigger.
Common mistakes
Collecting data without a failure-mode plan
Dashboards fill up, but nobody knows which change means what.
Instead: Start from the failure modes and the decisions they should trigger, then choose sensors and features.
Ignoring sensor mounting and calibration
Readings drift or reflect the mount, and alarms lose credibility.
Instead: Specify mounting, calibrate, and build self-diagnosis into the firmware.
Setting one alarm level for every machine
Some machines alarm constantly while others fail unnoticed.
Instead: Set limits per asset from its own baseline and operating conditions.
Streaming everything to the cloud
Network and storage costs grow quickly while alerts depend on the link.
Instead: Reduce data at the edge and send raw waveforms only when needed.
Where we've built this
The case study describes the request, the algorithm and data-analysis challenges, and how the iReDS system was delivered.
Case studyTurning machine vibration into condition-monitoring viewsThe iReDS system covers the whole chain described here: accelerometer hardware and firmware, dashboards, fleet-level web analysis and a choice of local or cloud processing.Was this useful?
Where this shows up in our work
SolutionIndustrial IoT & IntelligenceWhen the question is how to connect sensors on existing machines to a monitoring and analytics platform, from firmware to dashboards, that is our industrial IoT work.For what changes when the machines must keep running during the rollout, see Engineering connected products for machines that keep running.
Apply this to your product