


Insights / Industrial IoT
IoT Dashboard Library: Building SCADA-Style Dashboards in Qt with QSimpleScada
Why SCADA-style projects need operator dashboards, and how QSimpleScada, Indeema's open-source Qt library, builds them from widgets and a saved layout.

The short answer
An IoT dashboard library gives you ready-made widgets and a layout editor, so a monitoring screen is assembled and bound to device data instead of being drawn from scratch. QSimpleScada is the library Indeema built for this in Qt: it manages devices, boards and widgets, lets you arrange a dashboard with the mouse, saves the layout to a file and loads it in your app. Custom widgets are written in QML. It suits Qt desktop, mobile and embedded projects that need SCADA-style screens quickly.
Why SCADA-style projects need dashboards
Off-the-shelf SCADA covers many plants, but plenty of projects need their own monitoring software: a product with its own device, an unusual data model, or an embedded screen. In every one of them the dashboard is the human-machine interface. It is how a person sees the system and decides what to do.
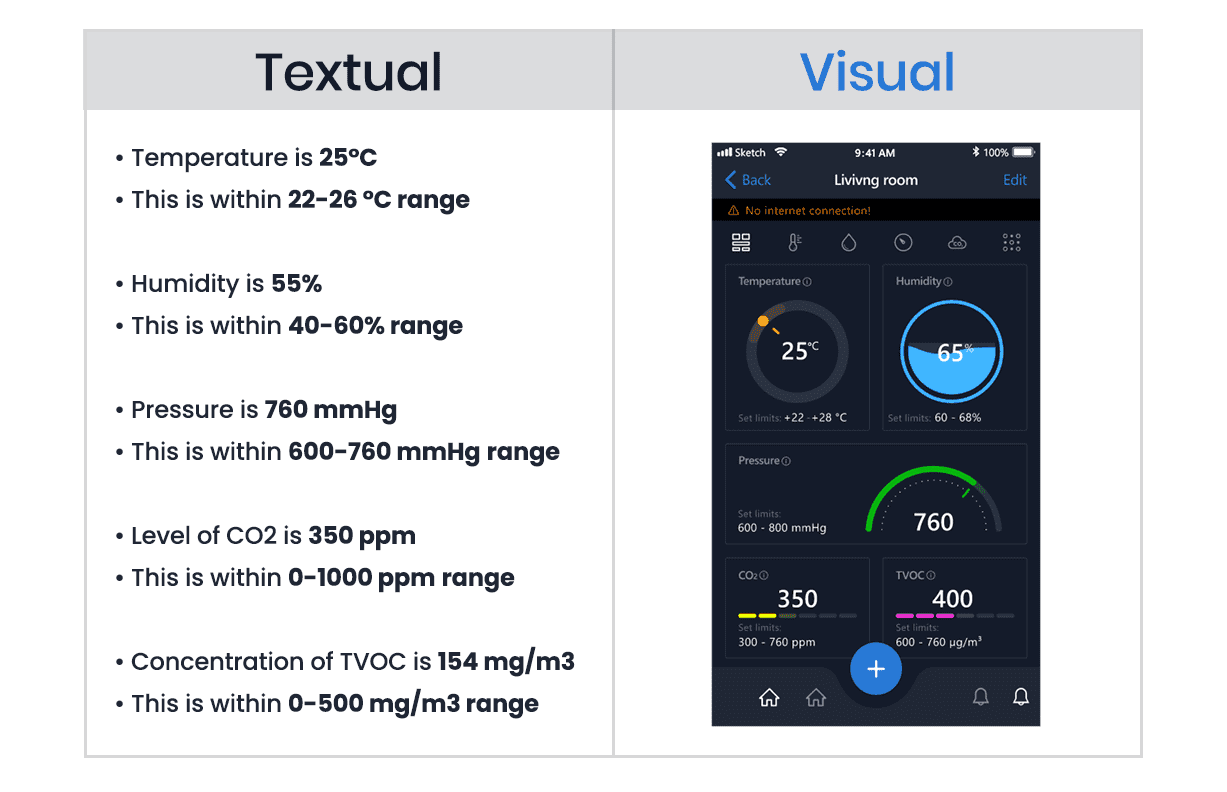
A good dashboard makes deviations obvious, shows where a fault sits, and turns a stream of readings into trends a person can act on. The comparison below comes from UBreez, an air-quality product where QSimpleScada was used to show sensor readings.
What QSimpleScada is
Indeema builds many SCADA and SCADA-like projects in the Qt framework, and kept needing a quick way to produce device dashboards. QSimpleScada is the result: a lightweight Qt library, open source under the MIT licence, published in a public GitHub repository. It targets desktop, mobile and embedded Qt projects, and assumes you know Qt/C++ and QML.
- Devices and boards: the library handles connections to devices and the boards (dashboards) attached to them.
- Visual editing: in editing mode you create, move and resize widgets with the mouse, then save the layout to a file and load it in your app.
- C++ core, QML widgets: the base widget is C++, and a QML interface lets you write your own widgets the way you write any QML UI and load them at runtime.
- EEIoT widget set: a companion collection of preconfigured widgets, such as a knob, a linear gauge and a water-level indicator, published alongside the library.
- Dashboard library
- A reusable set of visual widgets plus the plumbing that binds them to live data and stores their layout, so monitoring screens are configured rather than rebuilt for every project.
Building a dashboard step by step
The library was released as version 0.9.x. Clone the repository and include its project file in your own `.pro` file; the EEIoT widgets are added the same way. Then register a device, create a controller and give the device a board:
// 1. Describe the device the dashboard represents
QScadaDeviceInfo *lDeviceInfo = new QScadaDeviceInfo();
lDeviceInfo->setName("Test Device");
lDeviceInfo->setIp(QHostAddress("127.0.0.1"));

// 2. A controller manages all devices and their boards
QScadaBoardController *mController = new QScadaBoardController();
mController->appendDevice(lDeviceInfo);

// 3. Create a board for a device that is already appended
mController->initBoardForDeviceIp("127.0.0.1");

// 4. Editing mode lets you create, move and resize widgets
mController->setEditingMode(true);

// 5. Place the controller in your window
QGridLayout *mainLayout = new QGridLayout(ui->centralWidget);
mainLayout->addWidget(mController);If no device exists at the given IP address, no board is created. With editing mode on, the board shows a dotted background and a context menu for adding widgets.
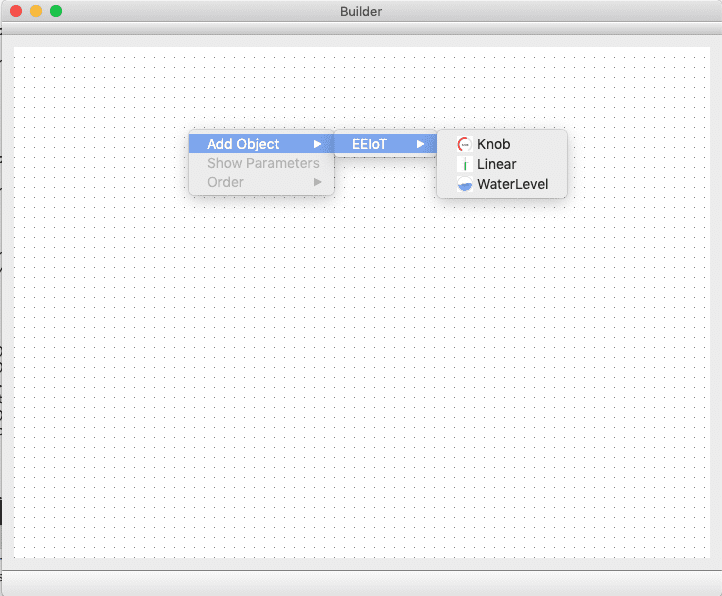
To use a widget collection, tell the controller where its QML resources live through the `QMLConfig` singleton in `qscadaconfig.h`. Each folder becomes a widget group, and if two folders share a name, the one added later replaces the first. The dynamic properties declared in a widget's QML metadata are accessible from QSimpleScada, which is what makes more complex dashboards practical.
Once a layout is right, save it as a project file (`.irp`). In the production app, set up a controller with no devices or boards and call `openProject()` with the path to that file.
Two sample apps: a builder and a weather dashboard
Two small applications were published with the library to show the workflow end to end.
- Builder: a simple dashboard editor that uses QSimpleScada and the EEIoT widgets to compose a dashboard and save it as an `.irp` file for later use.
- Weather: a dashboard built in the Builder, with temperature, humidity and pressure widgets fed from the OpenWeatherMap API. Enter a city and country code, such as `Kyiv,ua`, and the three widgets update for that location.
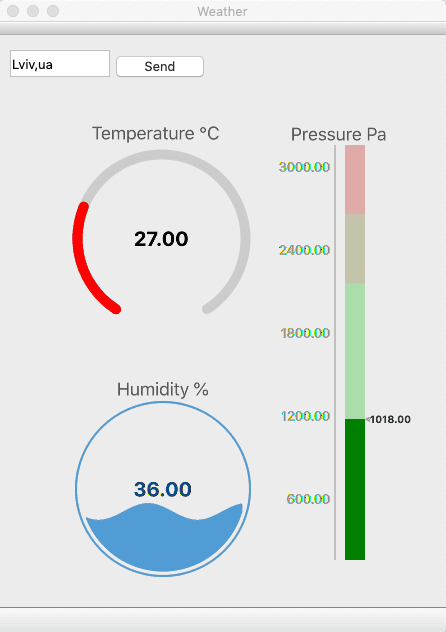
The split between the two apps is the useful pattern: the layout is designed once in an editor and stored as data, and the runtime app only loads it and binds live values.
When a dashboard library is the right tool
| Approach | Fits when | Watch out for |
|---|---|---|
| Dashboard library inside a native Qt app | The screen runs on a desktop, panel or embedded device, often next to the equipment | Library maintenance and compatibility with your Qt version are your responsibility |
| Web dashboard or IoT platform dashboards | Many users need remote access from browsers across sites | Customisation limits, and the security model of remote access |
| Fully custom UI | The interface is the product and must match a specific brand and workflow | Highest effort; every widget, layout and binding is built and tested by you |
The engineering implication: a dashboard is not the whole SCADA
A dashboard library solves visualisation and layout. Device communication, alarm handling, history, user roles and audit trails are still separate design work, and they usually decide whether operators trust the screen. Treat the library as the HMI layer of a larger system.
Storing layouts as data rather than code pays off beyond speed. Layouts can be versioned, reviewed and adjusted for a new site without a new build, and the same widgets can be reused across products.
How to approach your monitoring dashboard
Before you choose a library or build your own
- List the decisions operators make from the screen, and the readings each decision needs.
- Decide where the screen runs: next to the equipment, in a control room, or in a browser.
- Keep layout as data (a project file) and bind widgets to a clear device data model.
- Design limits, colours and alarm states consistently across every widget.
- Plan alarms, history and access control alongside the dashboard, not after it.
- Check licence, maintenance status and platform support of any library you adopt.
Where we've built this
For a SCADA monitoring product where the dashboard is delivered on the web rather than in a native Qt app, see the VikingSCADA case.
Case studyExtending a SCADA product with cloud monitoring and gateway updatesA web IIoT application that collects data from SCADA units at remote oil, water and gas sites and shows it on operator dashboards with alerts.For monitoring screens on machines that have to keep running, see Engineering connected products for machines that keep running.
Was this useful?
Apply this to your product