

1. Front-end JavaScript/Angular debugging
Currently, a lot of tools like Chrome DevTools (also known as chrome debugger) and Firefox Developer Tools support front-end debugging. While these two are the most popular ones, other browsers also have tools of their own. Let’s consider Chrome DevTools for our bug-eliminating adventure.
1.1 Debugging JavaScript
Let’s be honest, debugging can sometimes be really time-consuming. Especially, if simple commands such as console.log() or window.alert().
You have to write and then remove additional code and, sometimes, you can even commit code that includes these methods (even if you thought you had removed them). But if there are any linters set up, console or alert methods will be highlighted in the code.
Here’s when Chrome DevTools comes to the stage with a noble mission to debug code without these tedious instruments. Among its other perks, CSS and HTML editing, testing the network and site speed are our favorite ones.
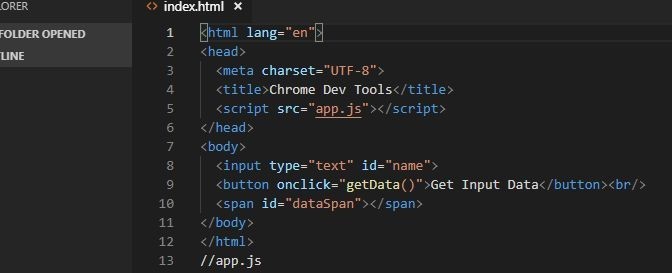
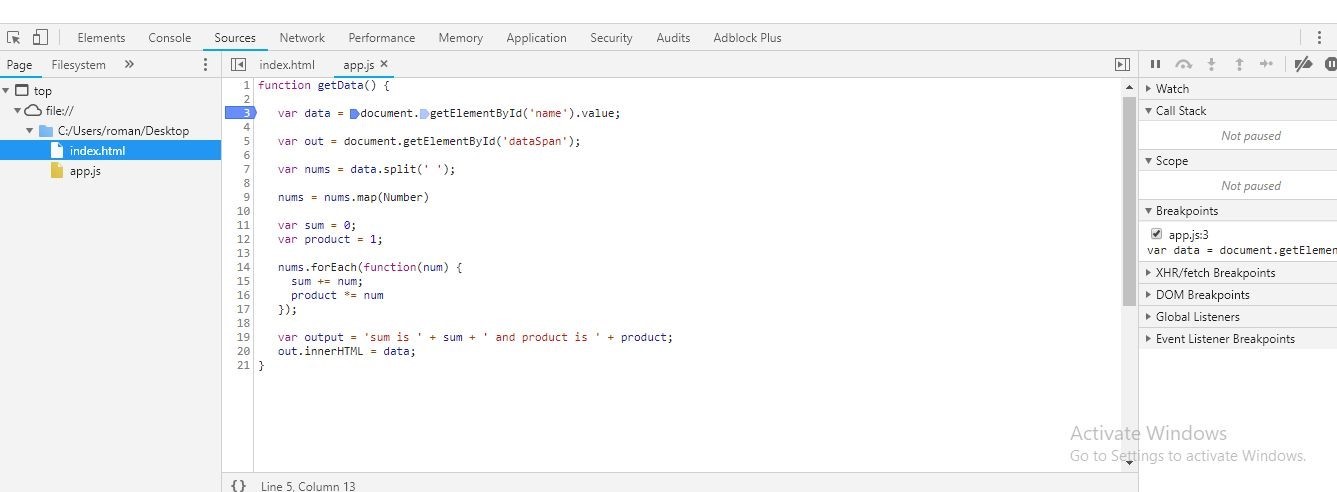
Let’s create a simple web page with JavaScript method getData() that simply collects the data from the name input field, creates a DOM node with dataSpan ID, and then adds the input field value to that DOM element.
Here’s how our page’ll look like:
In HTML:
In JavaScript:
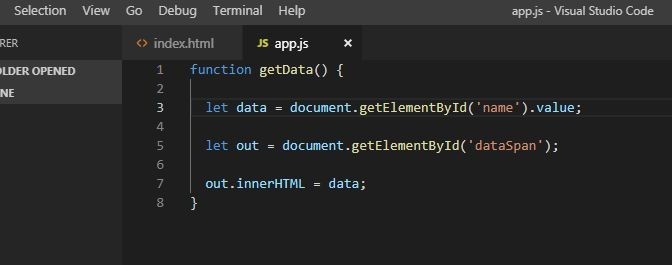
Let’s save it under app.js name.
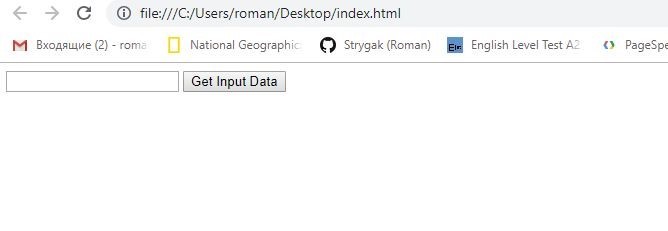
That’s how the page will appear in browser:
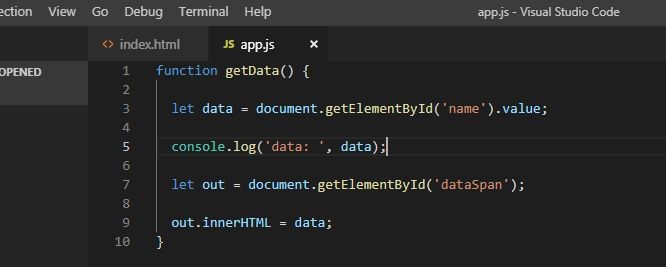
To look over how the method works prior to storing it in dataSpan, we can use the old-fashioned console.log(data) or window.alert(data). Here’s what we’ll see when launching the file in VS Code:
That is, however, the most primitive approach.
So, instead, we’ll use Chrome DevTools and validate that everything works as we plan using breakpoints.
Breakpoint is simply a line of code at which we want to stop running code to examine how it works (or doesn’t work) accurately.
Back on track, let’s launch the page in Google Chrome and:
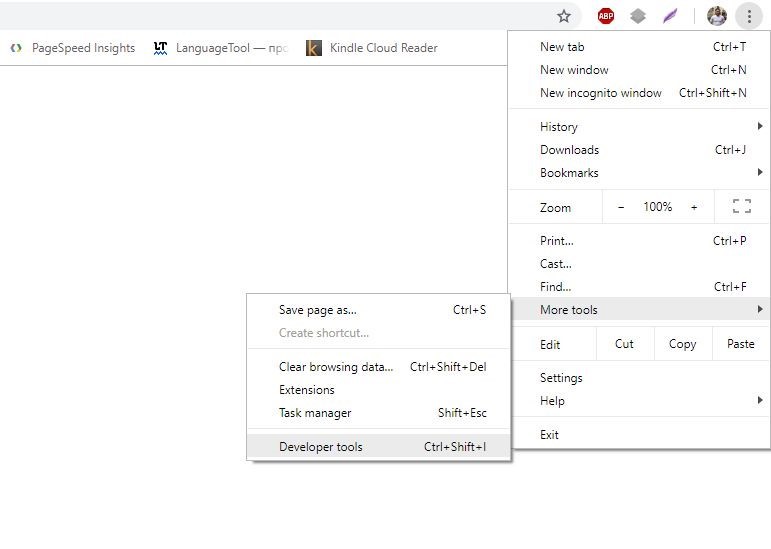
- To open Chrome Develop Tools, in the upper-right corner of the browser, click to open Customize and control Google Chrome menu.
- From the menu, select More tools, and then select Developer tools.
Alternatively, we can use Ctrl+Shift+I keyboard shortcut (we prefer this approach, but that’s up to you).
After we’re in, let’s pause the code at a breakpoint:
- With Chrome DevTools launched, select the Sources tab.
- From the Sources pane, in the Page view, select app.js (the JavaScript file we created previously).
- In the Editor Pane, to the left of the let data =document.getElementById('name').value; line of code, click the line number 3.
With this in place, we’ll set a line-of-code breakpoint, which is nicely highlighted in blue so we can see exactly where we’ve set it. Also note that the selected variable’s name automatically adds up to the Breakpoints > Local section, in the JavaScript Debugging pane.
1.2 Managing Increments at Which the Function Is Executed
Setting a breakpoint means that the function will stop execution on that breakpoint. We must then enable executing the code line-by-line to inspect the changes in our variable.
At the top-left of the JavaScript Debugging pane are the basic breakpoint run commands:
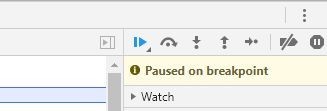
The first, Resume script execution button will continue the code execution until the code ends or until the next breakpoint.
Let’s enter hello world in our name field. The line will expand with data = “hello world”. Now let’s click Step over next function call button.
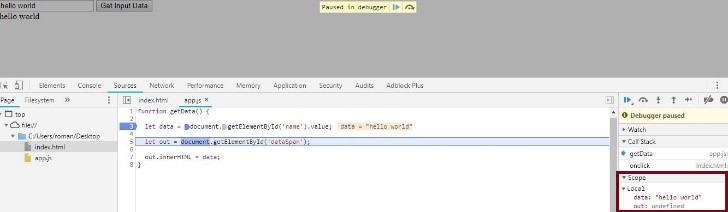
The selected breakpoint line is executed and the debugger will select the next one. Expand the Scope pane to see the value of the data variable. It has changed to “hello world”, which we have previously entered. It simply displays our variable on a specific line of code. Click Step over next function call again to run the selected method and proceed to the next line.
If you refresh the page, the value of the out variable will be updated to the DOM element. To the left of the variable, you can click the Expand () icon to view its value. If you click Step over next function call, in the browser, the “hello world” text will be added to the dataSpan again.
2. More Complex Javascript Debugging
Let’s say we want to execute more complicated function that definitely requires some debugging. For example, we want users to enter space-separated numbers. The function will then evaluate and output these numbers, their sum, and multiplication result (product).
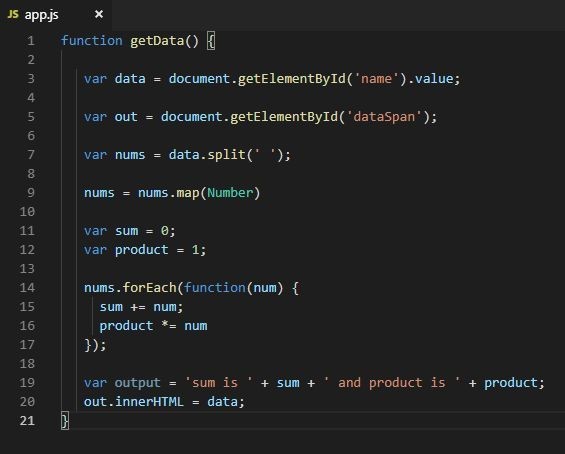
For this purpose, we’ll modify our app.js to look like the screenshot above. Let’s refresh the page and do some debugging:
- Click 3, the line number of let data = document.getElementById('name').value;, to set a breakpoint.
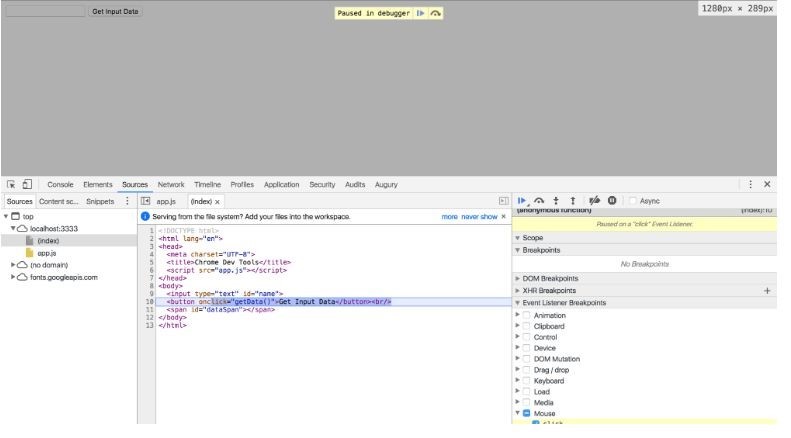
- In the browser, enter 23 24 e in the input field. Here we intentionally add both numbers and a letter to cause an error—these can’t be added or multiplied.
- Click Step over next function call.
On the screenshot, we can see that both sum and product have a NaN (not a number) value. This indicates that we have to fix our code right away.
2.1 Another Way to Set Breakpoints
In the majority of cases, your code is a lot longer and, perhaps, concatenated into a single line. For example, let’s assume we have 1000 lines of code. In this case, setting breakpoints by clicking the line numbers every time looks pretty unrealistic, isn’t it?
For this purpose, DevTools features excellent tool for setting breakpoints on events that occur when interacting with browser. On the JavaScript Debugging pane, click Event Listener Breakpoints to expand it with event categories.
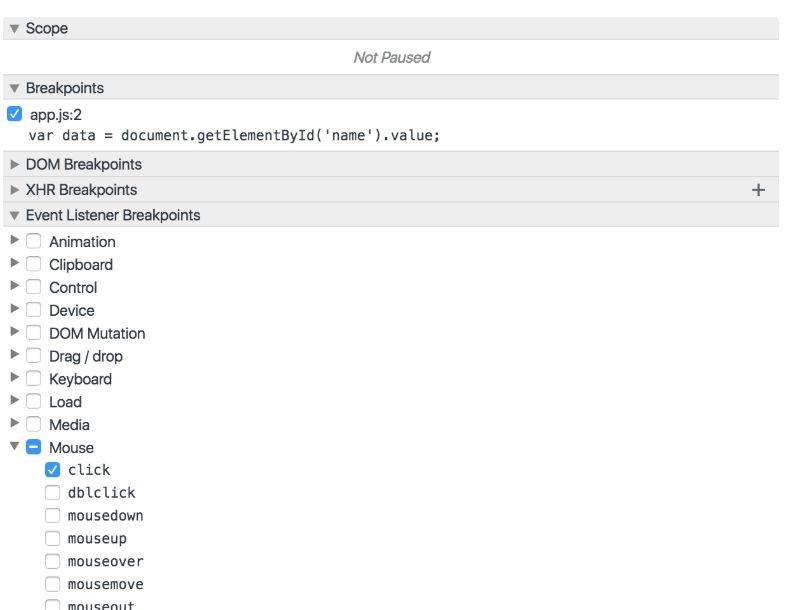
As you can see, we’ve set a breakpoint on Mouse > click event anywhere in our code. So, without the need to manually add a breakpoint, when you click the Get Input Data button, the execution will be paused on this onclick event.
Clicking Step over next function call will sequentially lead us through the code used to process the click action.
Via Event Listener Breakpoints, you can set breakpoints at a variety of event types such as Keyboard, Touch, and XHR.
2.2 The “debugger” Keyword
When you type the debugger keyword anywhere in your code, Chrome DevTools will pause executing at that line and highlight it similarly to breakpoints. You can use this instrument to debug JavaScript in Chrome or other browsers. Just remember to remove the word from the code when you’re done.
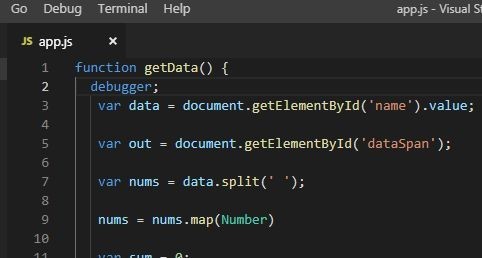
The code in the screenshot above will be paused on the line that contains the debugger word and will launch Chrome DevTools. That is equivalent to setting a breakpoint on that specific line of code. You can also manage the code execution using Step into next function call and Step over next function call buttons as we did before.
3. To Sum It Up
At the beginning, we considered console.log() and window.alert() and found them not really useful. We were supposed to use them a lot throughout the code, which could make the code heavier and slower if we forgot to remove these commands when commiting.
As the code grows, Chrome Developer Tools can be much more efficient to catch any bugs and evaluate the performance in general.
4. How to debug Angular
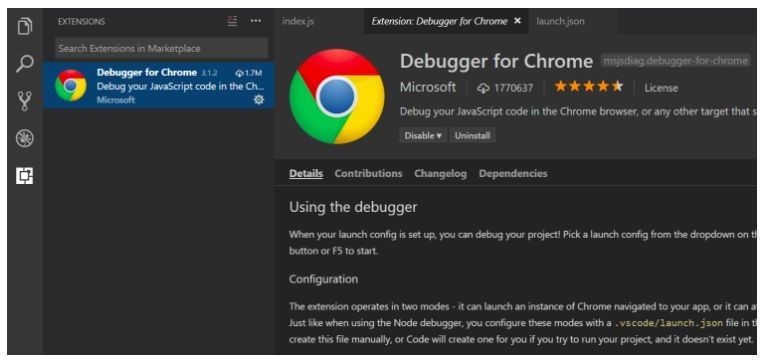
The easiest way to debug Angular code via Visual Studio Code (VS Code). To start debugging, you will need to install the Debugger extension to your Chrome browser:
- Launch VS Code with your current project, open the Extensions tab. Or press Ctrl+Shift+X on your keyboard.
- Enter Chrome in the search field.
- From the search results, select Debugger for Chrome and click Install.
- After you install the extension, the Reload button will appear. Click it to complete the installation and activate the Debugger in the browser.
4.1 Setting Breakpoints
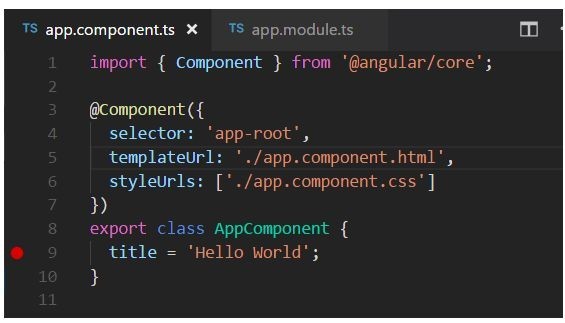
Exactly as we did before, in the app.component.ts, click the line number to the left of the line. The set breakpoint will be denoted with a red circle icon.
4.2 Debugger Configuration
First, we’ll need to configure the debugger:
- From the File Explorer, navigate to the Debug view. You can also use Ctrl+Shift+D shortcut.
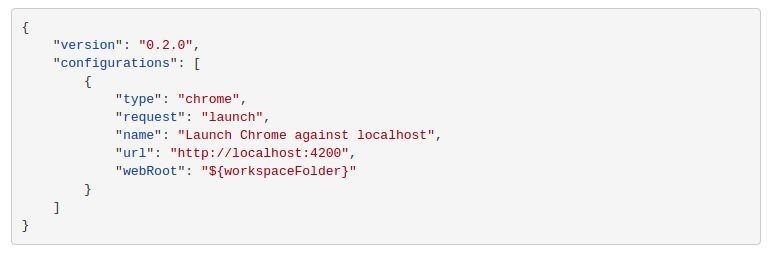
- Click Settings icon button to create launch.json. That’s the configuration file we’ll use.
- From the Select Environment drop-down, select Chrome. This will create a new .vscode folder with launch.json file in your project.
- Launch the file.
- To fit the file for our purpose, in the url method, change the localhost port from 8080 to 4200.
- Save changes. Your file will look as follows:
- Press F5 on the keyboard or click Start Debugging button to launch the Debugger.
- Launch Chrome.
- Refresh the page to pause the code at the set breakpoint.
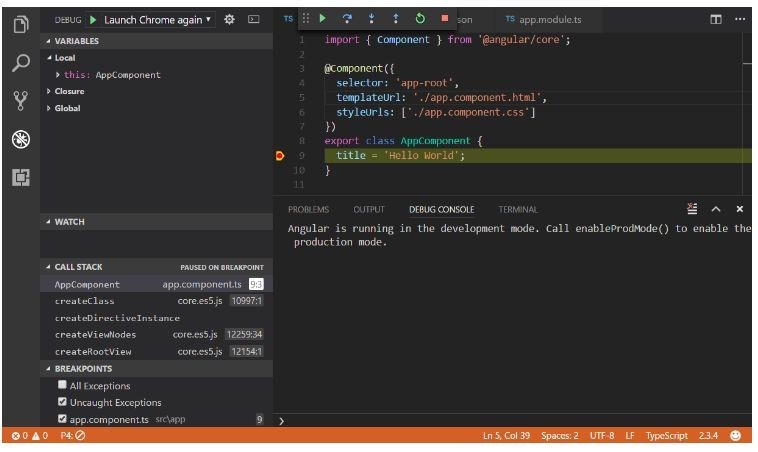
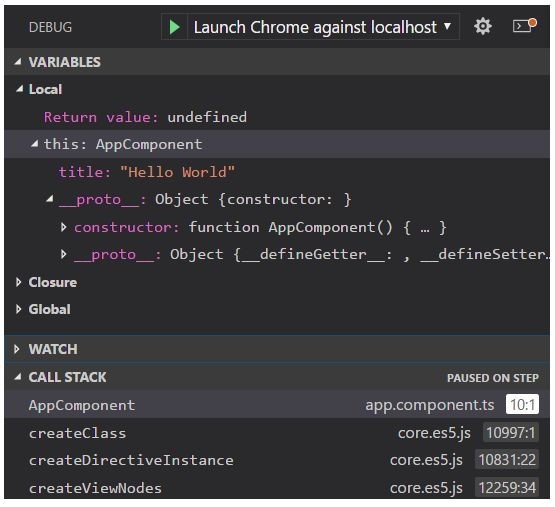
You can sequentially browse through the code using F10 button inspecting the variables and their change.
5. README
The Debugger for Chrome extension contains lots of info about additional configurations, working with sourcemaps, and resoling various issues. You can view them directly in VS Code by clicking the extension and selecting Details tab.
6. How to debug Back End (Node.js)
Here you’ll find out how to debug Node.js code. Here are the most common approaches:
- Using Chrome DevTools (well, that’s by far our favorite).
- Using IDEs such as Visual Studio Code, Visual Studio, WebStorm, etc.
We’ll use VS Code and Chrome DevTools for illustration.
Chrome and Node.js use the same JavaScript engine, Google V8, which means we can use the tools we used for front end debugging.
To do this:
- Launch your project in VS Code.
- Navigate to Console tab.
- Enter or paste npm start --inspect command and press Enter.
- Ignore the suggested “chrome-devtools://…” URL (there is a better way).
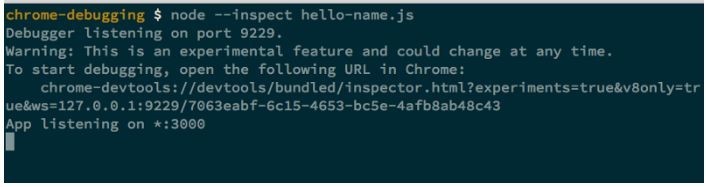
- Launch Chrome and enter or paste “about:inspect”. This will redirect you to the Devices page of DevTools.
- Click Open dedicated DevTools for Node hyperlink.
The node.js debugging process is done the same way we did on front-end side using breakpoints. This is pretty useful that you don’t need to switch to IDE. This way, both back end and front end can be debugged using the same interface.
Thanks for reading and hope you enjoyed this article. Subscribe to our updates, we have lots more cool stuff up in our sleeve.