


Insights / Industrial IoT
IoT predictive maintenance: from vibration data to a maintenance decision
How IoT predictive maintenance turns vibration and camera data into a planned repair: sensors, edge processing, machine learning and the work order.

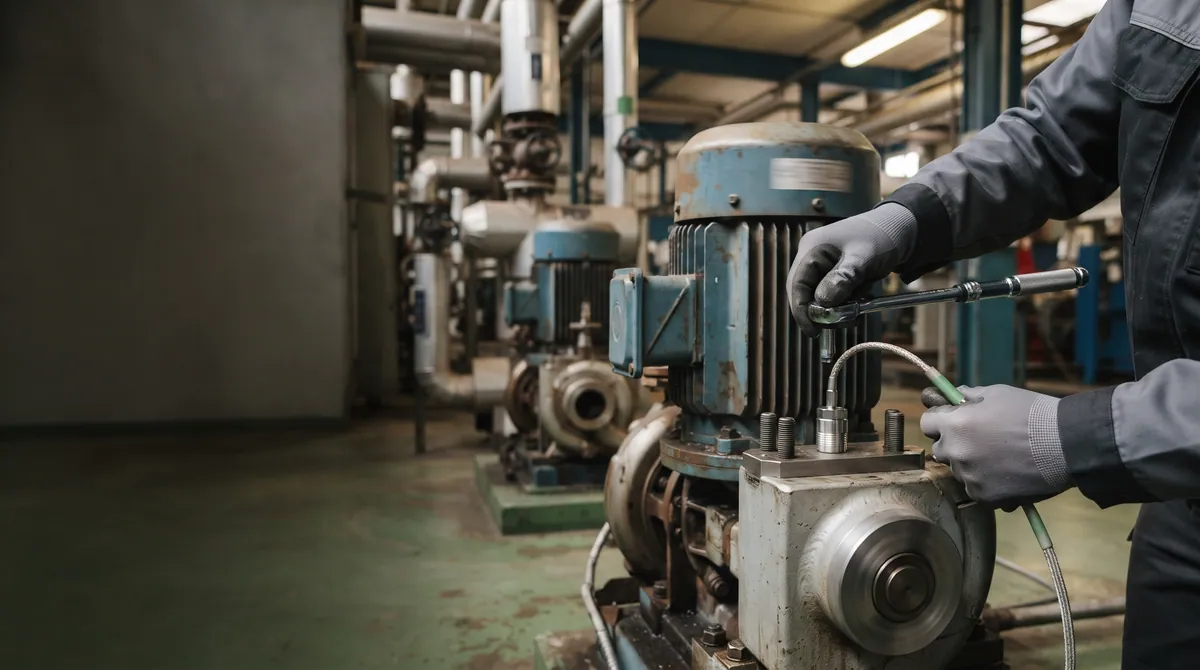
The short answer
IoT predictive maintenance uses sensors on running equipment – mostly vibration, plus temperature, motor current and cameras – to detect a developing fault early enough to plan the repair instead of reacting to a breakdown. Firmware or a gateway turns raw signals into features, and software compares them with reference levels or with a machine learning model, such as a random forest, trained on normal and faulty behaviour. When the trend shows a fault developing, the system warns a person with the asset and the likely fault type, and the warning becomes a work order. Each link matters: the wrong sensor or a loose mount spoils everything after it.
Key takeaways
- Predictive maintenance is a chain – sensor, sampling, features, decision, work order – and the weakest link sets the result.
- Sensor choice, mounting and sampling decide which faults you can see at all; no model recovers a frequency you never captured.
- Start with reference levels, then add machine learning – a random forest on vibration features is a practical first model – once you have confirmed faults.
- A warning is only useful if it reaches a person with the asset, the likely fault and enough time to plan.
- On cheap, redundant or quickly swapped equipment, condition monitoring or run-to-failure can be the better choice.
What IoT predictive maintenance is
- Predictive maintenance
- Maintenance planned from the measured condition of a machine and the trend of that condition, rather than from a calendar or after a breakdown.
Most rotating machinery fails gradually. A bearing with a damaged race, a misaligned coupling or an unbalanced rotor changes how the machine vibrates long before it stops. Preventive maintenance ignores that signal and replaces parts by the calendar; reactive maintenance waits for the breakdown. Predictive maintenance watches for the change and plans the repair around it.
IoT is what makes this practical across a whole plant. Route-based vibration surveys with a portable analyser have existed for decades, but a technician visits each machine only now and then. A connected sensor measures all the time, sends the result over a network and lets software watch many assets at once. The question this article answers is what has to be true at every step for that stream of data to end in a maintenance decision that a team trusts.
| Strategy | When work happens | What it needs | Main cost |
|---|---|---|---|
| Reactive (run to failure) | After a breakdown | Spare parts and a repair crew on call | Unplanned downtime and secondary damage |
| Preventive (time-based) | On a fixed schedule | A maintenance calendar | Parts replaced while still healthy |
| Condition monitoring | When a measured value crosses a limit | Sensors and alarm limits | Alarms can come late for fast faults |
| Predictive | When the trend shows a fault developing | Sensors, history and a model of normal behaviour | Data, engineering effort and alert discipline |
The engineering chain from sensor to work order
Every predictive maintenance system, bought or built, has the same five links. A weakness in an early link cannot be repaired by a later one: no model can find a fault frequency that the sensor never captured.
- SenseA vibration sensor, often with temperature, mounted rigidly near the bearing or load zone it is meant to watch.
- SampleThe signal is captured at a rate and for a duration that cover the fault frequencies of that machine, in more than one axis where it matters.
- ExtractFirmware or a gateway turns raw waveforms into features: overall levels, spectra, envelope values and their trends.
- DecideFeatures are compared with reference levels or a machine learning model of normal and faulty behaviour, and a change is classified.
- ActA warning reaches a person with the asset, the likely fault and the trend, and becomes a planned work order.
Every inspection result goes back into the history, so limits and models improve with each confirmed fault.
Choosing and mounting the sensor
Vibration is the most informative signal for rotating machinery, because most mechanical faults – imbalance, misalignment, looseness, bearing and gear damage – show up in it first. Temperature usually rises later, when the damage is already advanced. Motor current helps where nothing can be mounted on the machine itself.
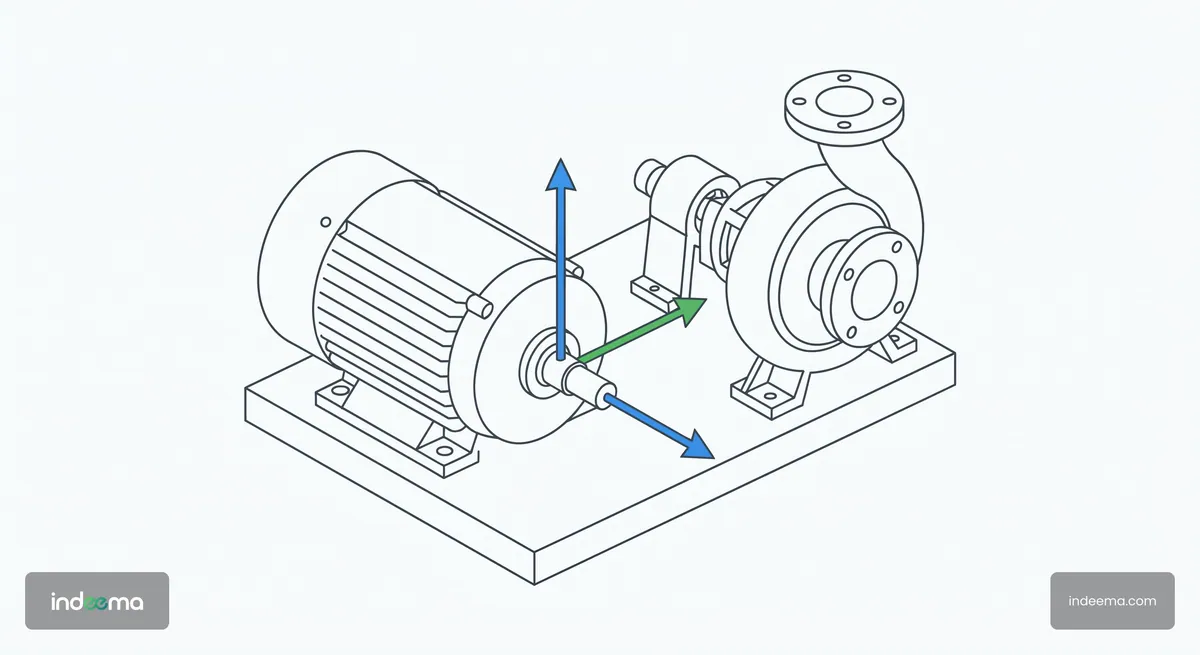
- Sensor type. MEMS accelerometers are compact, inexpensive and easy to build into a connected node; piezoelectric sensors cover a wider frequency range with lower noise. Early bearing damage shows at high frequencies, so check bandwidth and noise floor against the faults you want to catch, not only the price.
- Axes. One axis can miss a fault that shows in another direction. Misalignment often appears axially, imbalance radially. Multi-axis sensing adds little cost at the sensor and saves a second installation.
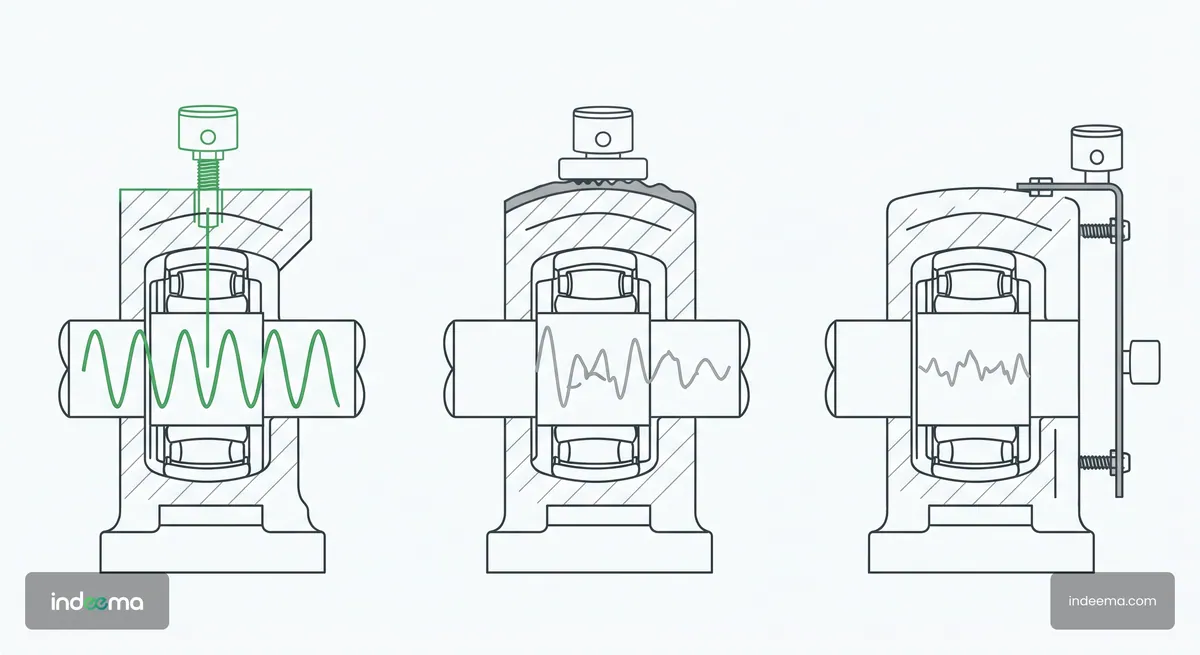
- Mounting. The mount is part of the measurement. A stud or a rigid bonded mount on a clean, flat surface near the bearing passes high frequencies; a magnet, or a sensor on a thin cover plate, damps them or adds resonances of its own. Mount the same way on every machine of a type, or the readings cannot be compared.
- Environment and power. Heat, oil, washdown and metal around the antenna decide whether a wireless node works in practice. A battery-powered node trades how often it measures against how long it lasts, and that is a design decision, not a detail.
Sampling, and where to process the signal
The sampling rate has to cover the highest fault frequency you care about, with margin, and each capture has to be long enough to separate the closely spaced frequencies that tell one fault from another. Slow machines need longer captures; fast ones need higher rates. Machines with variable speed also need the speed at the moment of capture, or the spectrum cannot be read correctly.
Raw waveforms are large. Streaming all of them from every node is rarely sensible over a low-power radio or a metered connection, so most systems split the work between the edge and the cloud.
| Where | Good for | Watch out for |
|---|---|---|
| On the sensor node or gateway | Overall levels, spectra and envelope features; fast local alarms; keeps working when the network drops | Limited compute and memory; firmware updates must be planned for the life of the device |
| In the cloud | Comparing many machines, long trends, training and retraining models, dashboards and reports | Bandwidth and the cost of moving data; delay before an alert |
| Both | Features and alarms at the edge, plus a raw waveform on request or when a limit is crossed | Two places to keep consistent and to secure |
The hybrid row is the usual answer: compute features continuously at the edge, send them on a schedule, and capture a full waveform when something changes, so that an analyst or a model has the evidence behind each alert.
Reference levels, machine learning or both
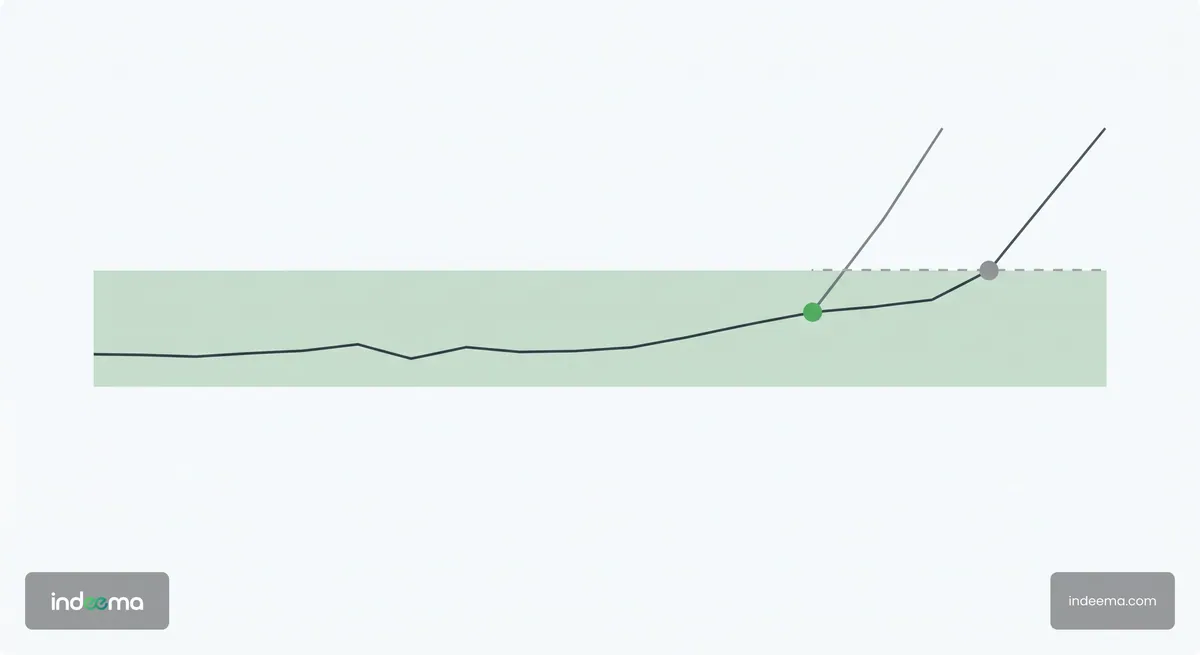
There are two ways to decide that a machine is no longer healthy. Reference levels are fixed limits: an overall vibration level, or the amplitude at a known bearing or gear frequency, that should not be exceeded on this machine. They are transparent, easy to explain to a maintenance team and work from the first day. Their weakness is that one limit rarely fits every machine, load and speed.
Machine learning instead learns what normal and faulty look like from data. Supervised models take features such as RMS, kurtosis, crest factor and the energy around the running speed and its harmonics, and classify the state of the machine or the type of fault. They adapt to each asset and can tell an inner-race defect from looseness. They need history, ideally with confirmed faults, and someone who owns their errors.
For feature-based vibration diagnostics, a random forest is often the most practical first model. It combines many decision trees, captures non-linear relations between features, tolerates noisy measurements and needs little memory and compute, so it can run on a gateway or even on the sensor node. Support vector machines are a similar option. Deep neural networks working on raw spectra or waveforms can find patterns that hand-made features miss, but they need far more labelled data and compute. Fuzzy logic sits between rules and learning: it encodes an engineer’s diagnostic rules but grades the answer – normal, warning or fault – instead of a hard yes or no.
| Question | Reference levels | Machine learning model |
|---|---|---|
| Works from | The first day, with limits per machine class | Enough history of normal operation, better with confirmed faults |
| Explains itself | Yes: a value crossed a limit | Only if the output names the features and the likely fault |
| Changing load and speed | Poorly, unless limits are set per operating state | Better, if those states are in the training data |
| Main risk | Late or false alarms from limits that fit no machine well | Silent drift, and alerts no one can justify |
My own research has been on the signal side of this choice: correlation analysis of rolling-bearing vibration with outer- and inner-race defects, a vibration monitoring platform for in-wheel electric motors, and data-driven detection of wheel imbalance from accelerometer signals. It grew out of work with colleagues at the Karpenko Physico-Mechanical Institute of the National Academy of Sciences of Ukraine on correlation and coherent cross-spectral analysis of vibration as a periodically non-stationary random process, and continued with colleagues at Ivan Franko National University of Lviv. In the published imbalance study the classifier is a fuzzy-logic algorithm that grades each analysis window as normal, warning or imbalance; in a follow-up paper, not yet published, I train a random forest on time- and frequency-domain features from the same kind of test bench. What I take from that work is that features grounded in the physics of the machine are what make any model trustworthy. Start with reference levels, keep the waveforms, and add machine learning once you have labelled faults to teach it.
Adding cameras: what vibration cannot see
Vibration shows how rotating parts behave. It says little about what a conveyor looks like. A torn or drifting belt, material spilling at a transfer point, a blocked chute, a damaged roller or a guard left open can all develop without a clear vibration signature. Cameras see them directly.
Computer vision models running on or near the camera can watch a line continuously: track the belt edges to detect drift, compare frames with a reference to spot damage or foreign objects, and flag spillage or jams. Like vibration models, they need training images from your own line, lighting that stays consistent, lenses protected from dust and a clear rule for what becomes a warning.
At Indeema we also use cameras that analyse conveyors and other machine elements visually. The two signals answer different questions – vibration describes how rotating parts behave, images describe the condition and position of the parts you can see – so warnings from both should reach the same person and the same work order.
From early warning to a work order
A prediction that nobody acts on prevents nothing. The last link is as much organisational as technical: who receives the warning, what it contains and how it becomes planned work.
What a useful warning contains
- The asset, its location and the measurement point, not a sensor ID
- The trend that triggered it, compared with the machine’s own history
- The likely fault type, when the system can identify it, and the evidence behind it
- A severity that maps to an action: watch, inspect, plan a repair or stop
- A way to record what the inspection found, so the next warning is better
Connect warnings to the maintenance system the team already uses, so a confirmed warning opens a work order with parts and a time window instead of an e-mail that gets lost. Then count false alarms as seriously as missed faults: every needless inspection costs a technician’s time, and too many of them teach people to ignore the system. The downtime cost method gives you the figures to weigh a missed failure against an unnecessary visit.

A worked example: iReDS
iReDS is a vibration-diagnostics product owned and developed by Indeema, and it follows the chain above. An accelerometer unit captures multi-axis vibration from rotating machinery, the signal is analysed against reference levels, and operators get alarms, a dashboard and reports. People decide and act on them; the system does not control the machine.
On top of the reference levels, AI analyses vibration signals and identifies the type of fault in bearings and other rotating mechanisms. That is what moves iReDS from condition monitoring to predictive maintenance: it warns of developing faults before failure so maintenance can be planned, instead of being forced by a breakdown.
As reported, iReDS reduces the number of unplanned downtimes caused by failures of key machine elements by up to 75%. That is an upper bound on monitored equipment in operation, not a typical or guaranteed result. What a plant gains depends on its machines, its failure history and how quickly warnings turn into work.
If you are weighing this kind of system for a production floor, see how it fits alongside other connected systems on the manufacturing page.
When condition monitoring is enough
Predictive maintenance is not always worth it. Data, models and the discipline around alerts all cost money, and on some equipment a simpler approach wins.
- Cheap, redundant or quickly swapped assets. If a standby pump can be switched in within minutes and the failure damages nothing else, run-to-failure or a periodic check can cost less than any sensor.
- Fast or random failures. Electronic faults and some hydraulic failures give little warning in vibration. A trend-based system has nothing to trend; protect these with design, redundancy or simple alarms instead.
- No history and no confirmed faults. Without them a learned model has nothing to learn from. Reference levels with sensible alarms – plain condition monitoring – are the honest first step, and they build the history a model will need later.
- No one to act. If warnings cannot become planned work within the time they give you, a prediction only tells you earlier about a breakdown you will still have.
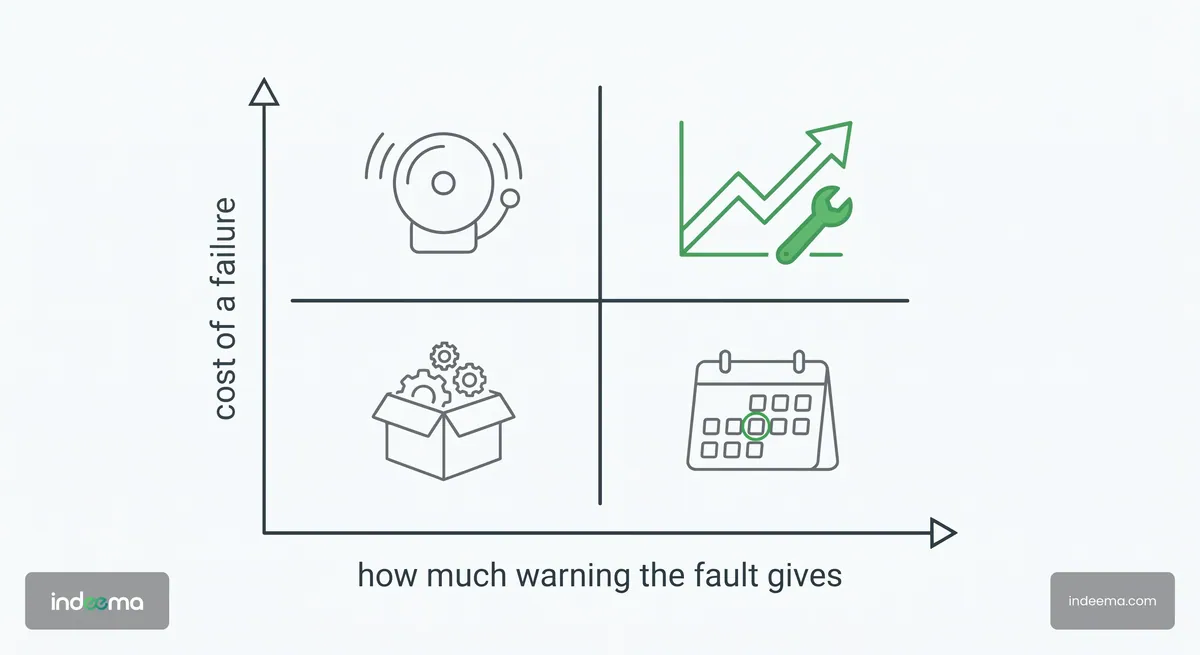
A practical rule: start with condition monitoring on the machines whose failures cost the most, keep the data, record what every inspection finds, and move to prediction where the history shows faults that develop slowly enough to plan for.
Where to start
Before you buy or build
- List the machines whose unplanned stops cost the most, using your downtime log
- Write down the failure modes behind those stops and how fast each one develops
- Check that a sensor can be mounted rigidly near each bearing or gear that matters
- Decide what is processed on the device, what is sent, and how the device will be updated
- Name the person who receives a warning and the system where it becomes a work order
- Agree how you will count false alarms and missed faults in the first months
If the list shows that sensing hardware, firmware and analytics have to be designed together for your equipment, that is research and development work rather than an off-the-shelf installation. Start with one line, prove the chain end to end, then scale.
Where we've built this
Case studyTurning machine vibration into condition-monitoring viewsiReDS, Indeema’s own vibration-diagnostics product: sensing, reference levels, AI fault-type identification and early warning on rotating machinery.Where condition monitoring and predictive maintenance fit among the connected systems of a production floor. Engineering connected products for machines that keep running.
Questions engineers ask
What sensors are used for IoT predictive maintenance?
For rotating machinery, mainly vibration accelerometers, often with temperature in the same node. Motor current sensing helps where nothing can be mounted on the machine. Choose the accelerometer by the frequency range of the faults you need to see, and mount it rigidly near the bearing.
How does predictive maintenance using IoT work?
Connected sensors measure the machine continuously, firmware or a gateway extracts features from the signal, and software compares them with reference levels or a learned model of normal behaviour. When a trend shows a fault developing, a warning goes to a person who plans the repair.
Which machine learning models are used for vibration-based predictive maintenance?
Feature-based models such as random forests and support vector machines are a practical start: they work on features like RMS, kurtosis and spectral energy, tolerate noise and are light enough for a gateway. Deep neural networks on raw spectra need more labelled data and compute. Fuzzy logic is useful when you want graded, explainable rules.
Is condition monitoring the same as predictive maintenance?
No. Condition monitoring raises an alarm when a measured value crosses a limit. Predictive maintenance uses the trend and, often, a model of the fault to warn early enough to plan the repair. Condition monitoring is usually the first stage and builds the history that prediction needs.
Should vibration data be processed at the edge or in the cloud?
Usually both. Compute features and urgent alarms at the edge, so the system keeps working when the network drops and sends little data, and use the cloud for trends across machines and for training models, with a full waveform sent when something changes.
Can cameras be used for predictive maintenance?
Yes, for faults you can see: belt drift and damage on conveyors, spillage, blockages, missing or damaged parts. Computer vision complements vibration rather than replacing it, because many bearing and gear faults show in vibration long before anything is visible.
Was this useful?
Apply this to your product
Discuss intelligence in your product
Sources
- Mats’ko, Yavors’kyi, Yuzefovych, Shevchyk: Invariant correlation analysis of the vibration of rolling bearing with defects on its outer and inner races (Materials Science, 2017) accessed 27 October 2026
- Karbovnyk, Yavorsky, Matsko, Shevchyk: Computerized vibration monitoring platform for in-wheel electric motors (Electronics and Information Technologies, 2024) accessed 27 October 2026
- Shevchyk: Data-driven detection of wheel imbalance using accelerometer signals and fuzzy logic (Advances in Cyber-Physical Systems, 2026) accessed 27 October 2026
- Yavorskyj, Yuzefovych, Matsko, Shevchik: Component correlation analysis of vectorial periodically non-stationary random processes (Radioelectronics and Communications Systems, 2014) accessed 27 October 2026
- Yavorskyi, Yuzefovych, Matsko, Shevchyk: Coherent cross-spectral analysis of periodically non-stationary vibration signals (Vidbir i obrobka informatsii, 2014, in Ukrainian) accessed 27 October 2026